|
|
| |
|
 March 10, 2004 Commentary
(mid-week edition)- March 10, 2004 Commentary
(mid-week edition)-
 Today I'd like to start out by
answering a question that I have gotten in more than a few e-mails lately. Most
of you know how I live to trade the ES e-mini, usually on the 3-minute
timeframe. It is, by far, my favorite instrument and timeframe to trade. I am
very catholic in my trading, though, and I am willing to trade anything that I
feel I can make money on. This latter point will become important in just a
minute. Today I'd like to start out by
answering a question that I have gotten in more than a few e-mails lately. Most
of you know how I live to trade the ES e-mini, usually on the 3-minute
timeframe. It is, by far, my favorite instrument and timeframe to trade. I am
very catholic in my trading, though, and I am willing to trade anything that I
feel I can make money on. This latter point will become important in just a
minute.
 The question I am getting is: how do I find the trading lately in
the mini? The honest answer is, I think it's very poor. Except for the last few
days, the good setups have been minimal, and the follow through on those setups
has been marginal in most cases. This is nothing like a few months back, when I
had some of the best trading in the minis that I have ever had. The question I am getting is: how do I find the trading lately in
the mini? The honest answer is, I think it's very poor. Except for the last few
days, the good setups have been minimal, and the follow through on those setups
has been marginal in most cases. This is nothing like a few months back, when I
had some of the best trading in the minis that I have ever had.
 The market
character changed, and I brought that up when I did the commentary about 'Mr.
Hat'. After that experience I got very selective and didn't overtrade a market
that just didn't have a lot of prime setups. I started spending more time on
longer-term stock plays, mostly on daily and weekly charts, and on the FX
markets. The minis will, again, be highly playable; they just aren't real
playable right now, for my style. The market
character changed, and I brought that up when I did the commentary about 'Mr.
Hat'. After that experience I got very selective and didn't overtrade a market
that just didn't have a lot of prime setups. I started spending more time on
longer-term stock plays, mostly on daily and weekly charts, and on the FX
markets. The minis will, again, be highly playable; they just aren't real
playable right now, for my style.
 Instead of 'sweating' this, I flow with it.
When a clean setup is there, I hit it. When it isn't, I don't try to force the
action. I stand aside and look elsewhere. That's why I like to 'trade anything
on any timeframe that I can make money on, as long as the setup is clear'. It's
just the normal nature of any given market to have periods when it trades well,
and periods when it doesn't. Instead of 'sweating' this, I flow with it.
When a clean setup is there, I hit it. When it isn't, I don't try to force the
action. I stand aside and look elsewhere. That's why I like to 'trade anything
on any timeframe that I can make money on, as long as the setup is clear'. It's
just the normal nature of any given market to have periods when it trades well,
and periods when it doesn't.
 That's the downside to specializing in only one
instrument. The most important thing to remember is that the plan must make
money, net overall, over time. I'm pointing this out to keep readers from
getting unrealistic expectations about the tradability of a given market 'at
all times'. Nothing abnormal or unusual is going on here in the minis in the
grander scheme of things, in my opinion. That's the downside to specializing in only one
instrument. The most important thing to remember is that the plan must make
money, net overall, over time. I'm pointing this out to keep readers from
getting unrealistic expectations about the tradability of a given market 'at
all times'. Nothing abnormal or unusual is going on here in the minis in the
grander scheme of things, in my opinion.
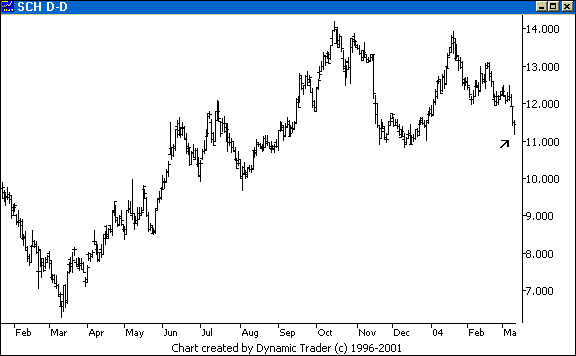
 Let's move on to some things that I
am looking at. I saw that SCH had a fairly nice 4-Point Continuation Pattern on
the daily chart. I've been watching and waiting for it to hit my potential
trade area, and today it did. I'll start with a daily chart with a lot of data,
to show the pattern and some of the overall context. The arrow points to the
potential trade area. Let's move on to some things that I
am looking at. I saw that SCH had a fairly nice 4-Point Continuation Pattern on
the daily chart. I've been watching and waiting for it to hit my potential
trade area, and today it did. I'll start with a daily chart with a lot of data,
to show the pattern and some of the overall context. The arrow points to the
potential trade area.

 This example is directed at those readers who
have bought the article and understand the pattern. I simply can't re-explain
in this short column what took me some eighty pages to explain in the article.
I have to assume the readers can see the pattern here and know why I am looking
where I am. I still feel that this is one of the best discoveries I have ever
made in the markets (besides the .886 retracement!), and it is still almost
unknown and totally underutilized at this point. This example is directed at those readers who
have bought the article and understand the pattern. I simply can't re-explain
in this short column what took me some eighty pages to explain in the article.
I have to assume the readers can see the pattern here and know why I am looking
where I am. I still feel that this is one of the best discoveries I have ever
made in the markets (besides the .886 retracement!), and it is still almost
unknown and totally underutilized at this point.
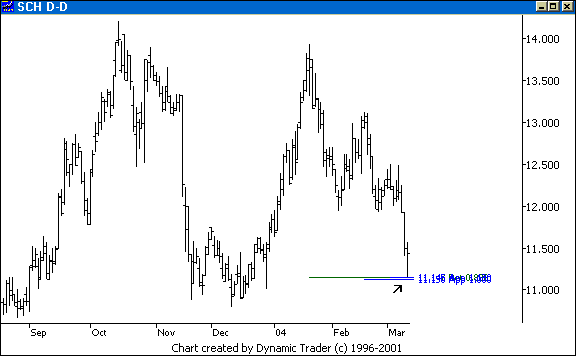
 Let's zoom in on the pattern, and
I'll show some of the key numbers in my grouping. Let's zoom in on the pattern, and
I'll show some of the key numbers in my grouping.

 My alarm went off today, alerting me that SCH
was starting to enter my area. I dropped down to 60-minute and 15-minute
charts, as well as 5-minute and 1-minute charts, to watch the action and 'make
my play'. Let's look at the 15-minute chart, showing how SCH reacted to the
potential trade area that I had been watching for over a month. My alarm went off today, alerting me that SCH
was starting to enter my area. I dropped down to 60-minute and 15-minute
charts, as well as 5-minute and 1-minute charts, to watch the action and 'make
my play'. Let's look at the 15-minute chart, showing how SCH reacted to the
potential trade area that I had been watching for over a month.

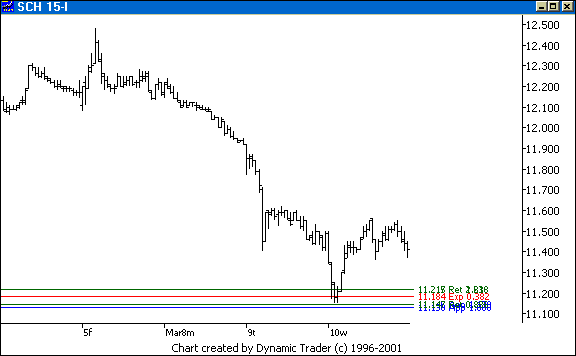
 I've added in a few more of the numbers from
the grouping onto the chart. Although they look a bit 'spread out' on this
close-up chart, the entire grouping is only about seven cents wide. That's an
extremely tight grouping for a daily chart trade. I've added in a few more of the numbers from
the grouping onto the chart. Although they look a bit 'spread out' on this
close-up chart, the entire grouping is only about seven cents wide. That's an
extremely tight grouping for a daily chart trade.
 You can see that SCH reacted
vigorously to the area. It's amazing that I was setting up this exact spot over
a month ago as a potential trade area. And SCH went right to it, and reacted.
This does not imply (of course) that anything more will come of this move.
Maybe that's it. That's all part of trading, and why proper trade management is
so critical to long-term success. You can see that SCH reacted
vigorously to the area. It's amazing that I was setting up this exact spot over
a month ago as a potential trade area. And SCH went right to it, and reacted.
This does not imply (of course) that anything more will come of this move.
Maybe that's it. That's all part of trading, and why proper trade management is
so critical to long-term success.
 What is important to my trading is that I get
a reaction off the grouping so I can get into the management phase. Take a look
back at my recent VTSS (the second play), SUNW, EP and FDX trades. Each one of
those trades was a winner. Yet look at them now. They all gave me what I need
most, an initial move off the grouping. And now this SCH trade is starting out
the same way. It is interesting to note that SCH was moving up and holding
while the broader market was getting hammered. What is important to my trading is that I get
a reaction off the grouping so I can get into the management phase. Take a look
back at my recent VTSS (the second play), SUNW, EP and FDX trades. Each one of
those trades was a winner. Yet look at them now. They all gave me what I need
most, an initial move off the grouping. And now this SCH trade is starting out
the same way. It is interesting to note that SCH was moving up and holding
while the broader market was getting hammered.
 Let's take a look, now, at
something I'm watching very carefully in the NDX. Everyone is bearish right
now, at least everyone I have heard. It's correction time now. I heard one
individual call for a two-thirds retracement of the entire up move so far, and
another call for a one-third retracement. I heard one mention 1025 on the
S&P. The volume on the QQQ's expanded significantly today, and the VIX
starting moving up nicely. But look at this. Let's take a look, now, at
something I'm watching very carefully in the NDX. Everyone is bearish right
now, at least everyone I have heard. It's correction time now. I heard one
individual call for a two-thirds retracement of the entire up move so far, and
another call for a one-third retracement. I heard one mention 1025 on the
S&P. The volume on the QQQ's expanded significantly today, and the VIX
starting moving up nicely. But look at this.

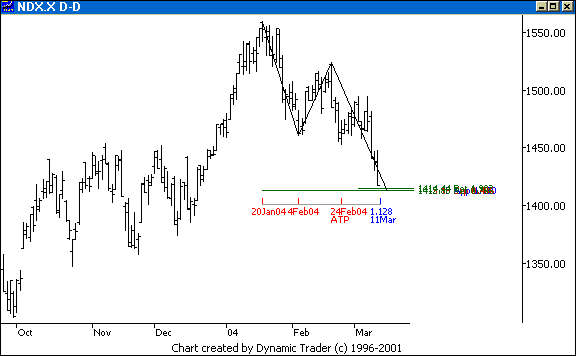
 The NDX is set up for a real nice 1.13
alternate ABCD and if it hits tomorrow, it's also a 1.13 time projection of the
AB leg. There is a really nice grouping right around that 1.13 ABCD completion
point. This area also happens to be dead on a .186 retracement of the entire
'bull market' move off the bottom. The NDX is set up for a real nice 1.13
alternate ABCD and if it hits tomorrow, it's also a 1.13 time projection of the
AB leg. There is a really nice grouping right around that 1.13 ABCD completion
point. This area also happens to be dead on a .186 retracement of the entire
'bull market' move off the bottom.
 This is a great looking ABCD setup, set up to
continue the trend. There is also an ABCD of sorts in the BC leg of this ABCD,
always a good sign in my book. Everyone is calling for a larger correction in
here. That makes me wonder if we won't at least get a respectable bounce in
this area. If I get an entry
trigger I'm going to take a shot in here. This is a great looking ABCD setup, set up to
continue the trend. There is also an ABCD of sorts in the BC leg of this ABCD,
always a good sign in my book. Everyone is calling for a larger correction in
here. That makes me wonder if we won't at least get a respectable bounce in
this area. If I get an entry
trigger I'm going to take a shot in here.
 I surely see the possibility of a
serious decline getting underway in here. But if we start to react off this
spot, then the spot is showing me it has some significance. And like the SCH
trade, and many of the others that I have pointed out in this column, I may get
my first thrust, and that's all I ask for to get me started on the right side
of the move. I surely see the possibility of a
serious decline getting underway in here. But if we start to react off this
spot, then the spot is showing me it has some significance. And like the SCH
trade, and many of the others that I have pointed out in this column, I may get
my first thrust, and that's all I ask for to get me started on the right side
of the move.
 Let's also look at something interesting in the SPX at the same
time. Let's also look at something interesting in the SPX at the same
time.

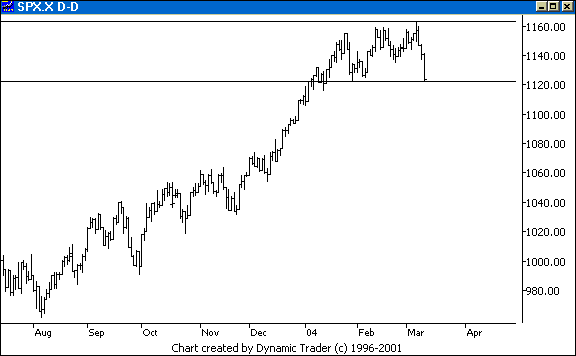
 The SPX plunged right down to the low end of
its current trading range. That low close sure looks scary. This thing is sure
to take out that range bottom and just plunge, right? Well, that's what
everyone is saying now. It may, but I'm looking for an alternate play. We may
only get a small bounce and then roll over, but we may also get a trap for the
shorts who dog-pile on when the bottom breaks by one tick. If ever there was a
trap being laid, this looks like it. At least on the first go around. The SPX plunged right down to the low end of
its current trading range. That low close sure looks scary. This thing is sure
to take out that range bottom and just plunge, right? Well, that's what
everyone is saying now. It may, but I'm looking for an alternate play. We may
only get a small bounce and then roll over, but we may also get a trap for the
shorts who dog-pile on when the bottom breaks by one tick. If ever there was a
trap being laid, this looks like it. At least on the first go around.
 I think some
important things are about to happen in here. I'm noticing a lot more
stock charts setting up with patterns. This has kept me plenty busy since the
mini trading has slowed down a bit. I find that I am passing many setups in
favor of better setups, or because I can only follow so many plays at one
time. I think some
important things are about to happen in here. I'm noticing a lot more
stock charts setting up with patterns. This has kept me plenty busy since the
mini trading has slowed down a bit. I find that I am passing many setups in
favor of better setups, or because I can only follow so many plays at one
time.
 I'm not going to get overly long in here, though, because this may
be the start of a bigger correction in here. On the other hand, I'm not going
to be timid and pass great looking setups because the market may
correct. You know what they say about the wall of worry… I'm not going to get overly long in here, though, because this may
be the start of a bigger correction in here. On the other hand, I'm not going
to be timid and pass great looking setups because the market may
correct. You know what they say about the wall of worry…
 One more
thing I want to mention. I'm watching SUNW in this area of $4.30-$4.40. There
are some things here that have me looking at a long play. See if you can see
what they are, and if anything happens here I'll discuss this in a future
commentary. One more
thing I want to mention. I'm watching SUNW in this area of $4.30-$4.40. There
are some things here that have me looking at a long play. See if you can see
what they are, and if anything happens here I'll discuss this in a future
commentary.
 The next column will be the weekend edition, posted on
Sunday. The next column will be the weekend edition, posted on
Sunday.
 |
|
|
| |
|
|
 NOTE: Reading this page or any page on the Kane
Trading website, or utilizing this website and any material NOTE: Reading this page or any page on the Kane
Trading website, or utilizing this website and any material
contained herein in any way, shall constitute an acknowledgement
that you have read, understood and agreed
to all the
disclaimers,
terms & conditions, and
policies of this site.
 |
|
 This website is best viewed with
MSIE 6.0, text size set to medium, and screen resolution set to 1024 by 768.
 Copyright © 2003 Kane
Trading. All rights reserved. Copyright © 2003 Kane
Trading. All rights reserved.
 |
|


