|
|
| |
|
 August
22, 2004 Commentary (weekend edition)- August
22, 2004 Commentary (weekend edition)-
 Today's
commentary should prove very interesting, and full of the methods that I have
laid out in my books. I know that there are more than a few readers that like
to follow my commentary, and glean out as much of my methodology as they can
from what I discuss in this free column, without having to lay out the nominal
cost of the books. I just want to say that although I do put an incredible
amount of content in this column for a free commentary, there is just no way
the subtleties and nuances of what I present in the over fourteen hundred pages
I've written can be even remotely grasped from just reading this
column. Today's
commentary should prove very interesting, and full of the methods that I have
laid out in my books. I know that there are more than a few readers that like
to follow my commentary, and glean out as much of my methodology as they can
from what I discuss in this free column, without having to lay out the nominal
cost of the books. I just want to say that although I do put an incredible
amount of content in this column for a free commentary, there is just no way
the subtleties and nuances of what I present in the over fourteen hundred pages
I've written can be even remotely grasped from just reading this
column.
 I'm going to keep my promise to discuss something else today
besides the ES, but first, what happened Thursday and Friday in the ES was so
classical, and as close to 'gimme' plays as I can imagine, that I decided to
show this, too. So, you get a bonus today, and the column won't be shorter, as
I had hoped, but overly detailed and time consuming for me. I'd like to spend a
little less time on this column so that I can try to have a life, but there is
always so much to show and say, I just go overboard. All the better for you,
though. I'm going to keep my promise to discuss something else today
besides the ES, but first, what happened Thursday and Friday in the ES was so
classical, and as close to 'gimme' plays as I can imagine, that I decided to
show this, too. So, you get a bonus today, and the column won't be shorter, as
I had hoped, but overly detailed and time consuming for me. I'd like to spend a
little less time on this column so that I can try to have a life, but there is
always so much to show and say, I just go overboard. All the better for you,
though.
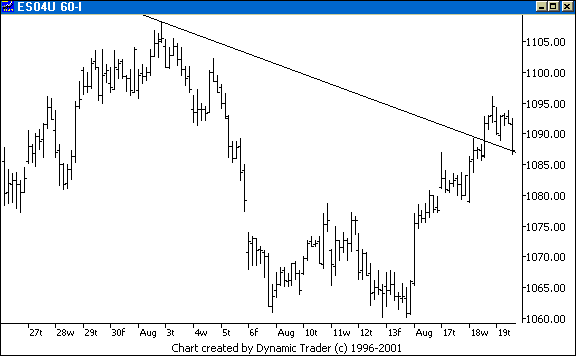
 I saw something unfold in the ES on Thursday afternoon. The ES came
back down from above, to test that key trendline we have been looking at. Let's
see how that looked on a 60-minute chart. I saw something unfold in the ES on Thursday afternoon. The ES came
back down from above, to test that key trendline we have been looking at. Let's
see how that looked on a 60-minute chart.

 Now, can you see the structure that the ES
was forming as it came down for that test? This is classic methodology from
Kane Trading on: Trading ABCD
Patterns. Let's drop down to a 13-minute chart, where I'll show the
trendline, the pattern, and the groupings that I had put together. Now, can you see the structure that the ES
was forming as it came down for that test? This is classic methodology from
Kane Trading on: Trading ABCD
Patterns. Let's drop down to a 13-minute chart, where I'll show the
trendline, the pattern, and the groupings that I had put together.

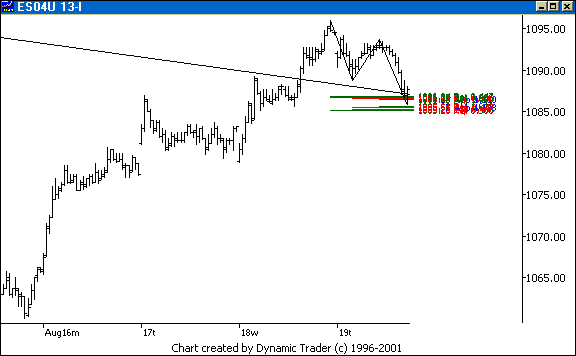
 Two tight, distinct groupings came together
for this area. The trendline went right through the area. Even though the
groupings look like they are a bit apart, keep in mind that the whole spread,
from top to bottom of both groupings, was only a point and a half, on 13-minute
chart that is spanning some thirty-five points here. This gets into my unique
concepts of 'layered support', a topic that is going to be extensively covered
in my new 'surprise' due out soon. Two tight, distinct groupings came together
for this area. The trendline went right through the area. Even though the
groupings look like they are a bit apart, keep in mind that the whole spread,
from top to bottom of both groupings, was only a point and a half, on 13-minute
chart that is spanning some thirty-five points here. This gets into my unique
concepts of 'layered support', a topic that is going to be extensively covered
in my new 'surprise' due out soon.
 Let's see how this played out from
here. Let's see how this played out from
here.

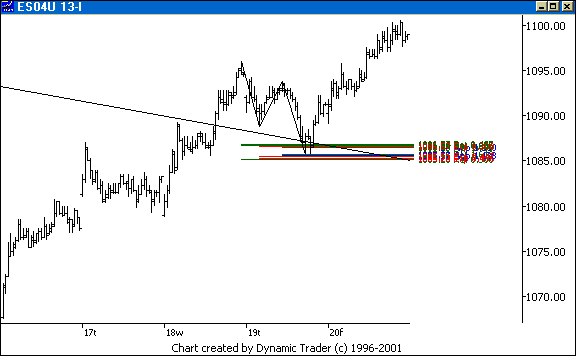
 Another classic ABCD pattern, set up to
continue the trend. And look at the additional 'context' from the trendline.
This is just quintessential Fibonacci trading according to my methodology. But
it gets even better. This would have been an overnight trade (although it could
have been taken as a daytrade, too). What if I didn't want to hold overnight,
or wanted to intraday trade this run in addition to a longer 'swing
trade'? Another classic ABCD pattern, set up to
continue the trend. And look at the additional 'context' from the trendline.
This is just quintessential Fibonacci trading according to my methodology. But
it gets even better. This would have been an overnight trade (although it could
have been taken as a daytrade, too). What if I didn't want to hold overnight,
or wanted to intraday trade this run in addition to a longer 'swing
trade'?
 Let's look at what happened on Friday's open. Talk about a
gift. Let's look at what happened on Friday's open. Talk about a
gift.

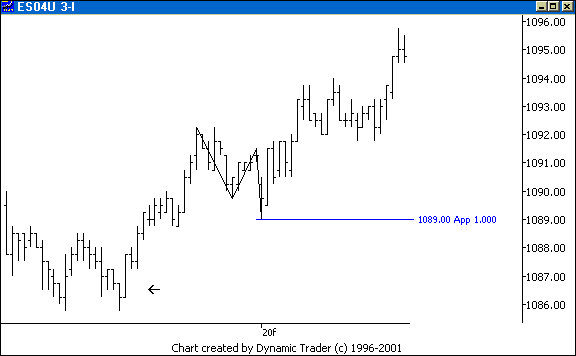
 The first arrow points to the area of the
groupings and trendline on the 13-minute chart, from Thursday afternoon. The ES
gapped open on Friday morning, right into another ABCD pattern, set up to
continue the trend off the larger 13-minute chart ABCD pattern. It reversed, to
the tick, on the 1.000 price projection. I couldn't ask for more than this, no
matter how hard I tried. And yes, I had other numbers at that completion
point. The first arrow points to the area of the
groupings and trendline on the 13-minute chart, from Thursday afternoon. The ES
gapped open on Friday morning, right into another ABCD pattern, set up to
continue the trend off the larger 13-minute chart ABCD pattern. It reversed, to
the tick, on the 1.000 price projection. I couldn't ask for more than this, no
matter how hard I tried. And yes, I had other numbers at that completion
point.
 As I always say, I don't trade just one number. I frequently show
only the most salient features in here. And as we saw in the previous chart,
the ES went on to go over 1100 before the close, without any significant
pullbacks to take me out of an 'intraday swing trade'. This is just beautiful,
classic trading for the methodology I have developed. As I always say, I don't trade just one number. I frequently show
only the most salient features in here. And as we saw in the previous chart,
the ES went on to go over 1100 before the close, without any significant
pullbacks to take me out of an 'intraday swing trade'. This is just beautiful,
classic trading for the methodology I have developed.
 Let's move on
to my promise to look at something else besides the ES. I'm noticing something
in gold that I want to keep an eye on. Let's look at a chart and see what that
might be. Let's move on
to my promise to look at something else besides the ES. I'm noticing something
in gold that I want to keep an eye on. Let's look at a chart and see what that
might be.

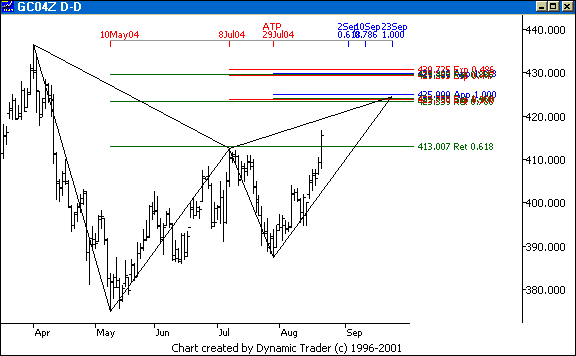
 Gold is possibly forming a 5-point pattern up
a little higher. I have two groupings that I am watching, based on the .786 and
.886 retracements. Before we discuss the rest of this potential setup, a
question arises. Why even learn the Kane Trading methodology here such as
forming the groupings, and knowing what all the numbers are? They are just
grouped around the .786 and .886. Why not just use those two retracements, and
I'm all set, right? Not even close. Gold is possibly forming a 5-point pattern up
a little higher. I have two groupings that I am watching, based on the .786 and
.886 retracements. Before we discuss the rest of this potential setup, a
question arises. Why even learn the Kane Trading methodology here such as
forming the groupings, and knowing what all the numbers are? They are just
grouped around the .786 and .886. Why not just use those two retracements, and
I'm all set, right? Not even close.
 If you are just taking things from the
commentary, without knowing the details of how I do this, you are asking for
trouble. It's all about another unique concept that I have developed, and that
is 'harmonicity' (unique in the way that I define and use it). This, too, will
be greatly detailed in the new 'surprise' that is coming up. Those other
numbers are critical for me to evaluate the potential of this trade, and how I
do that is totally unique to my methodology. If you are just taking things from the
commentary, without knowing the details of how I do this, you are asking for
trouble. It's all about another unique concept that I have developed, and that
is 'harmonicity' (unique in the way that I define and use it). This, too, will
be greatly detailed in the new 'surprise' that is coming up. Those other
numbers are critical for me to evaluate the potential of this trade, and how I
do that is totally unique to my methodology.
 Let's get back to gold. The time
factor implies this may take awhile to develop, to have the CD leg harmonious
with the AB leg, time-wise. The chart sure doesn't make me think that the
pattern won't complete until as late as September 30, though. This is one
factor I want to monitor as this develops. I am also planning on watching the
behavior as the first grouping is hit (if it is hit). The .786 grouping
would make this a classic Gartley pattern (notice I highlighted the B point,
which is a near perfect .618). I'm still allowing that it may bounce there and
continue to the upper .886 grouping, or just travel right to that. For me, it
will be about the behavior in the potential trade area. That will clue me as to
how to act. Let's get back to gold. The time
factor implies this may take awhile to develop, to have the CD leg harmonious
with the AB leg, time-wise. The chart sure doesn't make me think that the
pattern won't complete until as late as September 30, though. This is one
factor I want to monitor as this develops. I am also planning on watching the
behavior as the first grouping is hit (if it is hit). The .786 grouping
would make this a classic Gartley pattern (notice I highlighted the B point,
which is a near perfect .618). I'm still allowing that it may bounce there and
continue to the upper .886 grouping, or just travel right to that. For me, it
will be about the behavior in the potential trade area. That will clue me as to
how to act.
 Let me add one more thing in here that is just a bit curious. The
chart may get a little hard to read, but do your best to sort it all out and
see this. I'll add on a medial line and parallels. Let me add one more thing in here that is just a bit curious. The
chart may get a little hard to read, but do your best to sort it all out and
see this. I'll add on a medial line and parallels.

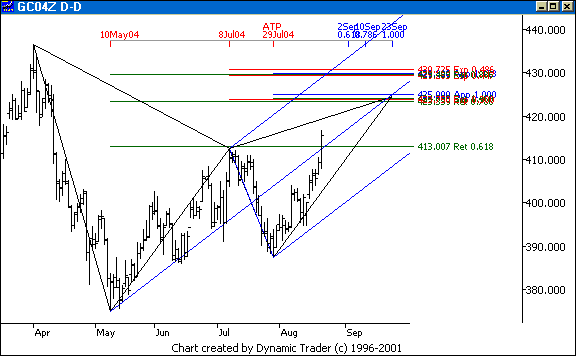
 The median line intersects exactly with the
potential .786 completion point at a 1.000 time projection of the AB leg.
Perhaps this will have no meaning at all as the price action unfolds. But it
sure is something I want to watch if the action begins to develop in that
area. The median line intersects exactly with the
potential .786 completion point at a 1.000 time projection of the AB leg.
Perhaps this will have no meaning at all as the price action unfolds. But it
sure is something I want to watch if the action begins to develop in that
area.
 The next commentary will be the mid-week edition, posted on
Wednesday. The next commentary will be the mid-week edition, posted on
Wednesday.
 |
|
|
| |
|
|
 NOTE: Reading this page or
any page on the Kane Trading website, or utilizing this website and any
material NOTE: Reading this page or
any page on the Kane Trading website, or utilizing this website and any
material
contained herein in any way, shall constitute an
acknowledgement that you have read, understood and agreed
to
all the disclaimers,
terms & conditions, and
policies of this site.
 |
|
 This
website is best viewed with MSIE 6.0, text size set to medium, and screen
resolution set to 1024 by 768.
 Copyright
© 2004 Kane Trading. All rights reserved. Copyright
© 2004 Kane Trading. All rights reserved.
 |
|


