|
|
| |
|
 April 3,
2005 Commentary (weekend edition)- April 3,
2005 Commentary (weekend edition)-
 Today I'm
going to cover a few items of business, and then we'll look at some charts.
First, it has come to my attention that people are having trouble printing many
of the website pages. I checked into this, and I was able to duplicate the same
problem. I wrote up the details on this in the What's New section, plus I did
an FAQ on it. If you've
had any trouble printing please read those over. Today I'm
going to cover a few items of business, and then we'll look at some charts.
First, it has come to my attention that people are having trouble printing many
of the website pages. I checked into this, and I was able to duplicate the same
problem. I wrote up the details on this in the What's New section, plus I did
an FAQ on it. If you've
had any trouble printing please read those over.
 Next, I want to welcome all the new
people coming over here from various forums. I have been being mentioned on a
lot of forums lately, and my traffic is absolutely soaring. Feel free to look
around and read the free articles and the approximately one hundred and fifty
or so free commentaries. There is a lot of free stuff here that should keep you
busy for a long time. Next, I want to welcome all the new
people coming over here from various forums. I have been being mentioned on a
lot of forums lately, and my traffic is absolutely soaring. Feel free to look
around and read the free articles and the approximately one hundred and fifty
or so free commentaries. There is a lot of free stuff here that should keep you
busy for a long time.
 I also want to mention that the subscribers section is going
extremely well in my opinion, with a lot of setups being shown in advance that
have played out very well, allowing things to be studied as they unfold. The
level is much, much higher than I ever expected it would be (and the amount of
time I spend is massively 'over budget'), but the feedback I am getting is
worthy of framing and putting up on my trading room wall. I also want to mention that the subscribers section is going
extremely well in my opinion, with a lot of setups being shown in advance that
have played out very well, allowing things to be studied as they unfold. The
level is much, much higher than I ever expected it would be (and the amount of
time I spend is massively 'over budget'), but the feedback I am getting is
worthy of framing and putting up on my trading room wall.
 I'm not
saying this in any way to try to talk anyone into the service. I just want to
say that the really detailed, high level material is in there (as opposed to
this free commentary here), and for those that have the books and are thinking
of a mentorship, or are in the program right now, this forum has been proving
to be a great place for really intense, right on the cutting edge of what I am
doing material. I'm not
saying this in any way to try to talk anyone into the service. I just want to
say that the really detailed, high level material is in there (as opposed to
this free commentary here), and for those that have the books and are thinking
of a mentorship, or are in the program right now, this forum has been proving
to be a great place for really intense, right on the cutting edge of what I am
doing material.
 I usually lift something from there to post in here, so you can get
an idea of some of what I do in that venue, but it's not very timely, and is
only a 'snippet' of what I do in there. I want to bring this up so that all the
newer viewers can understand that although I have something like one thousand
pages (in Word format) and some six or seven hundred charts free on the
website, I'm not giving away the best stuff. I usually lift something from there to post in here, so you can get
an idea of some of what I do in that venue, but it's not very timely, and is
only a 'snippet' of what I do in there. I want to bring this up so that all the
newer viewers can understand that although I have something like one thousand
pages (in Word format) and some six or seven hundred charts free on the
website, I'm not giving away the best stuff.
 You can't expect me to give the
books to you free, or spend hours per day working up the charts and writing up
some of my best setups in advance, and then just give it all away for free. I'm
altruistic to a point, but not that altruistic. This material has taken
me seven years and approximately 18,000 hours of my time to develop. You can't expect me to give the
books to you free, or spend hours per day working up the charts and writing up
some of my best setups in advance, and then just give it all away for free. I'm
altruistic to a point, but not that altruistic. This material has taken
me seven years and approximately 18,000 hours of my time to develop.
 As I have
said many times, you should be able to learn a lot from the free stuff on this
site. In my opinion, you can learn more here for free than you will learn
buying most other's material. But if you want to really see the best of what I
am doing you need the books, and if you want to see a lot of what I am looking
at, and how I'm applying it in the current market, you need to subscribe to the
members' section. As I have
said many times, you should be able to learn a lot from the free stuff on this
site. In my opinion, you can learn more here for free than you will learn
buying most other's material. But if you want to really see the best of what I
am doing you need the books, and if you want to see a lot of what I am looking
at, and how I'm applying it in the current market, you need to subscribe to the
members' section.
 I have mentioned that I read an average of two books per week since
I started, and up until I really started developing my own innovative material
and running this website, I kept up with that. Every one of those books I
bought at full retail (by the time I discovered eBay used book sales it was too
late). I have no regrets about the money I spent on those books, or any other
money I spent on my trading education. I always said if I got just one useful
tip from a book it was worth the price to me. I have mentioned that I read an average of two books per week since
I started, and up until I really started developing my own innovative material
and running this website, I kept up with that. Every one of those books I
bought at full retail (by the time I discovered eBay used book sales it was too
late). I have no regrets about the money I spent on those books, or any other
money I spent on my trading education. I always said if I got just one useful
tip from a book it was worth the price to me.
 I feel my books are filled cover to
cover with my best material. Yet there are still many, many people who follow
my site regularly, haven't bought a single book, and still think spending the
money is just too much. If four hundred dollars and change is too much for the
wealth of material in the sixteen hundred or so pages I've laid out, you might
want to rethink if becoming a full-time, successful trader is really what you
want to try to do. Just a thought. I feel my books are filled cover to
cover with my best material. Yet there are still many, many people who follow
my site regularly, haven't bought a single book, and still think spending the
money is just too much. If four hundred dollars and change is too much for the
wealth of material in the sixteen hundred or so pages I've laid out, you might
want to rethink if becoming a full-time, successful trader is really what you
want to try to do. Just a thought.
 Imagine going to Harvard, telling them you
want to be a doctor but you really don't want to pay for any classes or books,
and telling them there are plenty of free sites on the Internet where they'll
tell you all you need to know about doctoring. Enjoy what I offer for free, but
understand, if you want a quality education, that's not free. Not here,
and not anywhere on the Internet. I think the point is sufficiently driven into
the ground. Let's look at some charts. Imagine going to Harvard, telling them you
want to be a doctor but you really don't want to pay for any classes or books,
and telling them there are plenty of free sites on the Internet where they'll
tell you all you need to know about doctoring. Enjoy what I offer for free, but
understand, if you want a quality education, that's not free. Not here,
and not anywhere on the Internet. I think the point is sufficiently driven into
the ground. Let's look at some charts.
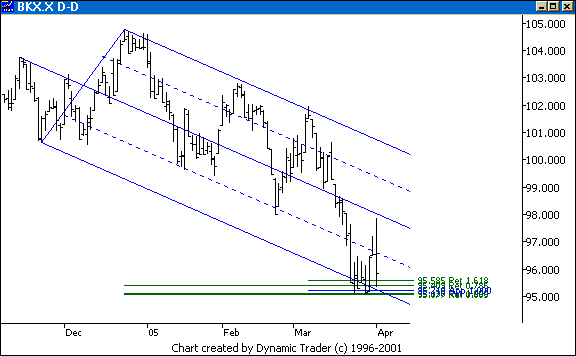
 I'll start with a chart I posted in the BKX
as it came together. I'll start with a chart I posted in the BKX
as it came together.


 In this 'context' the BKX is in a downtrend,
so playing off the bottom of a downsloping ML isn't the type of setup I'm
looking for. But this also has the potential to give me a lot of information on
the market's intention. Notice how well this set, with the division lines, has
represented the price action in the BKX. In this 'context' the BKX is in a downtrend,
so playing off the bottom of a downsloping ML isn't the type of setup I'm
looking for. But this also has the potential to give me a lot of information on
the market's intention. Notice how well this set, with the division lines, has
represented the price action in the BKX.
 A big grouping comes together, and
the BKX reacts to it, and rolls back down. Then up again, this time just about
to the ML, and back down. This is not bullish action in my mind. Notice the
level of indecision at what I feel is a fairly key area. I can use this
information as I form my various trade premises. A big grouping comes together, and
the BKX reacts to it, and rolls back down. Then up again, this time just about
to the ML, and back down. This is not bullish action in my mind. Notice the
level of indecision at what I feel is a fairly key area. I can use this
information as I form my various trade premises.
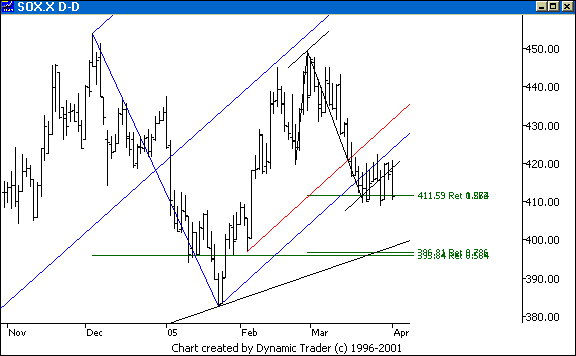
 Let's look at something I showed in
the SOX before the SOX got there. Let's look at something I showed in
the SOX before the SOX got there.


 I put a grouping together at an area equal to
the amount the SOX fell short of the ML in this set. This is shown with the two
small black lines. I just framed it out here, but one of the numbers is a 1.272
external retracement of the last thrust up, highlighted in black. The SOX
reacted immediately to the area, right at the intersection of the line and the
grouping. It was very indecisive, without follow through. I put a grouping together at an area equal to
the amount the SOX fell short of the ML in this set. This is shown with the two
small black lines. I just framed it out here, but one of the numbers is a 1.272
external retracement of the last thrust up, highlighted in black. The SOX
reacted immediately to the area, right at the intersection of the line and the
grouping. It was very indecisive, without follow through.
 When I first
posted this layout I mentioned that I expected the SOX might be headed for
another, lower grouping. The upsloping black line goes back to the '04 low. Now
that more time has passed and the line is continuing up, I will be looking more
at another grouping I have above this one. I'll leave it to the reader to build
that. When I first
posted this layout I mentioned that I expected the SOX might be headed for
another, lower grouping. The upsloping black line goes back to the '04 low. Now
that more time has passed and the line is continuing up, I will be looking more
at another grouping I have above this one. I'll leave it to the reader to build
that.
 The main point is to notice how the SOX can't get above the initial
area. Recall the BKX. You can see how I watch these key areas and get clues as
to what I think is going on. The main point is to notice how the SOX can't get above the initial
area. Recall the BKX. You can see how I watch these key areas and get clues as
to what I think is going on.
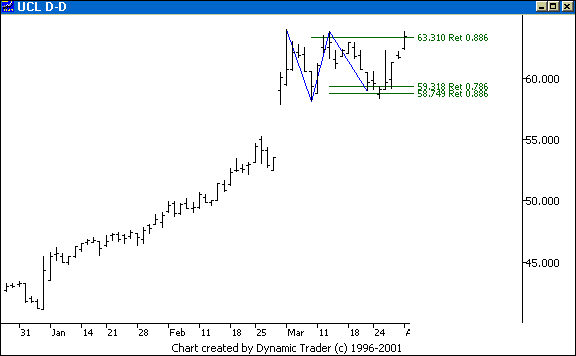
 Let's look at a setup I posted in advance (that's a
theme here today) in UCL. Let's look at a setup I posted in advance (that's a
theme here today) in UCL.


 UCL formed a 4-Point Continuation Pattern at
the same time the XOI and many other oils (like MUR, which I also posted)
formed really nice ABCD patterns. UCL and the rest really moved off their
areas. What made this really interesting was the behavior on the 15-minute
chart. Let's look at that. UCL formed a 4-Point Continuation Pattern at
the same time the XOI and many other oils (like MUR, which I also posted)
formed really nice ABCD patterns. UCL and the rest really moved off their
areas. What made this really interesting was the behavior on the 15-minute
chart. Let's look at that.


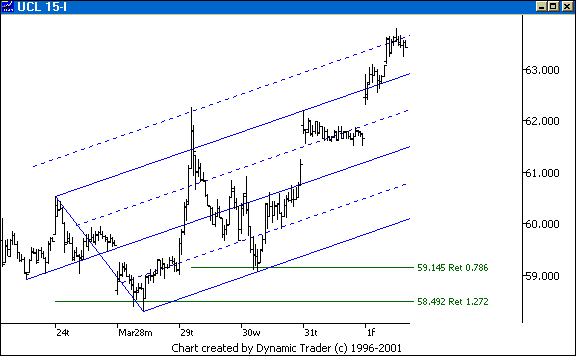
 Once UCL reacted to my area and gave me a
clean entry signal the trade was triggered. That was just after the area of the
median line set's final anchor point. I put just a 1.272 external retracement
onto the chart to show the general area where my grouping was. UCL rockets up,
and as soon as it starts, I put this median line set with division lines on the
chart. Once UCL reacted to my area and gave me a
clean entry signal the trade was triggered. That was just after the area of the
median line set's final anchor point. I put just a 1.272 external retracement
onto the chart to show the general area where my grouping was. UCL rockets up,
and as soon as it starts, I put this median line set with division lines on the
chart.
 Notice the upper ML // is exceeded, but UCL then reverses and heads
down, right off the next division line. An ABCD pattern forms, with a 'flat'
ABCD in the BC leg, a factor I highly prefer (having an ABCD in the BC leg). I
put a retracement on the chart that hits the lower ML // at a place that makes
sense based on the direction of the price action as it gets near. I actually
built an entire grouping based on many swings and that ABCD pattern into the
area, but the .786 shows you the basic spot. Notice the upper ML // is exceeded, but UCL then reverses and heads
down, right off the next division line. An ABCD pattern forms, with a 'flat'
ABCD in the BC leg, a factor I highly prefer (having an ABCD in the BC leg). I
put a retracement on the chart that hits the lower ML // at a place that makes
sense based on the direction of the price action as it gets near. I actually
built an entire grouping based on many swings and that ABCD pattern into the
area, but the .786 shows you the basic spot.
 I then wait to see how UCL reacts,
and I can make a second entry if I closed out the first play, I can add to the
position if I scaled out of some (I do a lot of scaling), or I can play two
positions, one longer-term which may be intact, and one shorter-term, such as
playing that first thrust, and now playing another one in here. This layout
helps me make my management decisions, and sets up potential plays. I then wait to see how UCL reacts,
and I can make a second entry if I closed out the first play, I can add to the
position if I scaled out of some (I do a lot of scaling), or I can play two
positions, one longer-term which may be intact, and one shorter-term, such as
playing that first thrust, and now playing another one in here. This layout
helps me make my management decisions, and sets up potential plays.
 Notice how UCL used the lines over
and over. That's not enough for me trade off by itself, but when I combine it
with patterns, groupings, my filtering aspects, and multiple other things I
have a lot of synergies, and the PTA's can jump right out at me. Is this
amazing, or what? How could I not be looking at this if I'm in a play on this
one? Notice how UCL used the lines over
and over. That's not enough for me trade off by itself, but when I combine it
with patterns, groupings, my filtering aspects, and multiple other things I
have a lot of synergies, and the PTA's can jump right out at me. Is this
amazing, or what? How could I not be looking at this if I'm in a play on this
one?
 The next commentary will be next weekend's edition, posted by April
10, 2005. The next commentary will be next weekend's edition, posted by April
10, 2005.
 |
|
|
| |
|
|
 NOTE: Reading this page or
any page on the Kane Trading website, or utilizing this website and any
material NOTE: Reading this page or
any page on the Kane Trading website, or utilizing this website and any
material
contained herein in any way, shall constitute an
acknowledgment that you have read, understood and agreed
to all
the disclaimers,
terms & conditions, and
policies of this site.
 |
|
 This
website is best viewed with MSIE 6.0, text size set to medium, and screen
resolution set to 1024 by 768.
 Copyright
© 2005 Kane Trading. All rights reserved. Copyright
© 2005 Kane Trading. All rights reserved.
 |
|


