|
|
| |
|
 December
25, 2005 Commentary (weekend edition)- December
25, 2005 Commentary (weekend edition)-
 Happy
Holidays to all my readers. Yes, it's Christmas day, and I'm still going to
take the time to write a commentary. I'll think of it as my Christmas present
for everyone. So far my revamping of the mentorship program is going well, and
as I mentioned, I'll 'introduce' that in January. Understand, I am not changing
the content of the material I teach, or the methodology, just in the 'user
friendly' aspects of the program. At this point I think I may also offer a few
different variations, to better suit this to potential students. Once I have it
all finalized I'll launch the updated pages and let everyone know. I am also
working on various other upgrades and small changes, and I'll discuss those as
they unfold. Happy
Holidays to all my readers. Yes, it's Christmas day, and I'm still going to
take the time to write a commentary. I'll think of it as my Christmas present
for everyone. So far my revamping of the mentorship program is going well, and
as I mentioned, I'll 'introduce' that in January. Understand, I am not changing
the content of the material I teach, or the methodology, just in the 'user
friendly' aspects of the program. At this point I think I may also offer a few
different variations, to better suit this to potential students. Once I have it
all finalized I'll launch the updated pages and let everyone know. I am also
working on various other upgrades and small changes, and I'll discuss those as
they unfold.
 Now, on to today's work. I realized I got myself in a bit of
trouble with my choice of charts last week for Jim's Chart of the Week. Not
that it wasn't a clean, straightforward setup that 'worked' as I expected,
since it was (in this case a good part of the action, and it was very clear
action, happened in the overnight session). No, what it really did was leave me
wanting to explain in greater detail how I am using a framework like that one
for my trading. I could just show the simple pop off the area and leave it at
that, but I felt that was so lacking in detail as far as what I try to do, and
how I read and use price action, that it just didn't do any justice to my
work. Now, on to today's work. I realized I got myself in a bit of
trouble with my choice of charts last week for Jim's Chart of the Week. Not
that it wasn't a clean, straightforward setup that 'worked' as I expected,
since it was (in this case a good part of the action, and it was very clear
action, happened in the overnight session). No, what it really did was leave me
wanting to explain in greater detail how I am using a framework like that one
for my trading. I could just show the simple pop off the area and leave it at
that, but I felt that was so lacking in detail as far as what I try to do, and
how I read and use price action, that it just didn't do any justice to my
work.
 I decided to take some pieces from this weeks members' commentary to
explain part of this. What I am attempting to convey is how I use the
information at hand to make decisions, as opposed to what I see many do, which
is a simple 'here's the pattern, trade the pattern regardless, end of story'
approach. I am using discretion and experience, along with all the things I
have learned and show in the books, to make what I think of as educated and
informed decisions. I hope this makes some sense. I decided to take some pieces from this weeks members' commentary to
explain part of this. What I am attempting to convey is how I use the
information at hand to make decisions, as opposed to what I see many do, which
is a simple 'here's the pattern, trade the pattern regardless, end of story'
approach. I am using discretion and experience, along with all the things I
have learned and show in the books, to make what I think of as educated and
informed decisions. I hope this makes some sense.
 Let's start out with a current look
at that 60-minute ES chart. I didn't want to use up a chart showing where we
left off last week when I posted the Chart of the Week, so you'll have to look
at this one and review it from here. We stopped last time right as the ES
completed the ABCD, where the lines and grouping come together. Let's start out with a current look
at that 60-minute ES chart. I didn't want to use up a chart showing where we
left off last week when I posted the Chart of the Week, so you'll have to look
at this one and review it from here. We stopped last time right as the ES
completed the ABCD, where the lines and grouping come together.

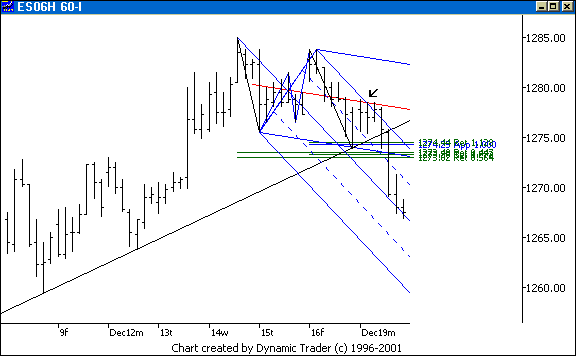
 From Monday: "I added the 'standard' and
modified Schiff ML sets to the pattern. I should have done that before, but I
get so tired of chartwork sometimes, I don't show everything I could. The arrow
shows where I was watching closely, where the two key lines hit. If I got an
ABCD up to that point, and then a rollover, well, that's what I mean by
watching the price action for clues. We can clearly see what happened, but what
did this look like up close? From Monday: "I added the 'standard' and
modified Schiff ML sets to the pattern. I should have done that before, but I
get so tired of chartwork sometimes, I don't show everything I could. The arrow
shows where I was watching closely, where the two key lines hit. If I got an
ABCD up to that point, and then a rollover, well, that's what I mean by
watching the price action for clues. We can clearly see what happened, but what
did this look like up close?
 Let's drop down to the 3-minute timeframe. Let's drop down to the 3-minute timeframe.

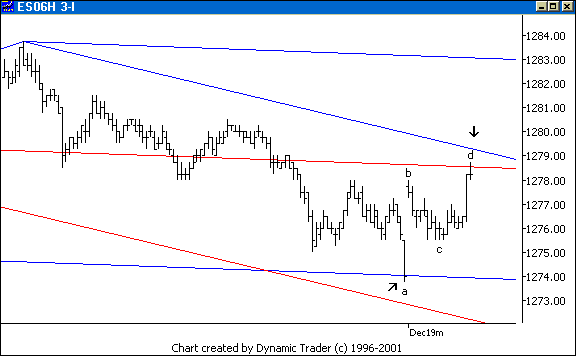
 The lines move about a little bit as the
timeframe changes, but these are accurate for this timeframe, as I recreated
them here. The ES comes off that modified Schiff ML set lower //, and forms a
nice ABCD right up to the two lines. This is what I don't want to see, but it
may be a 'wave 3', so I'm not worried yet. It's okay if it pulls back here
(just not as desirable), but it then must take off and blast the lines
out. The lines move about a little bit as the
timeframe changes, but these are accurate for this timeframe, as I recreated
them here. The ES comes off that modified Schiff ML set lower //, and forms a
nice ABCD right up to the two lines. This is what I don't want to see, but it
may be a 'wave 3', so I'm not worried yet. It's okay if it pulls back here
(just not as desirable), but it then must take off and blast the lines
out.
 Let's see what happened from here. Let's see what happened from here.

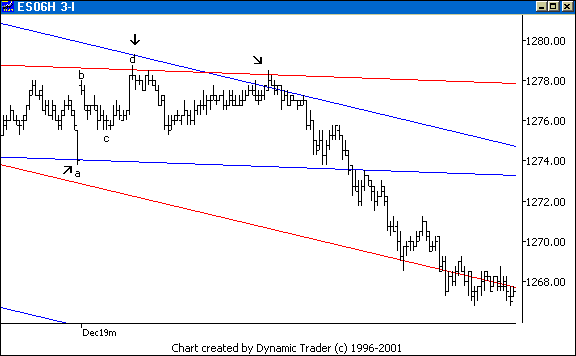
 The ES rolls right off the area, goes down a
bit more than I'd like, but then starts up. So far, so good. It then gets back
to the area of the lines, at the third arrow, and that's where I want to see
acceleration upwards. And what does it do? Goes right into the tank. The price
action here was clear and obvious. Keep in mind this is the 3-minute timeframe,
and the pattern is on a 60-minute timeframe. If I entered on an entry trigger
say off that c point, I would be out on the roll off the third arrow for close
to a scratch. As an aside, I deleted it off for clarity, but put that same set
I showed on the 3-minute chart last time on this action, and see how that set
is still being used." The ES rolls right off the area, goes down a
bit more than I'd like, but then starts up. So far, so good. It then gets back
to the area of the lines, at the third arrow, and that's where I want to see
acceleration upwards. And what does it do? Goes right into the tank. The price
action here was clear and obvious. Keep in mind this is the 3-minute timeframe,
and the pattern is on a 60-minute timeframe. If I entered on an entry trigger
say off that c point, I would be out on the roll off the third arrow for close
to a scratch. As an aside, I deleted it off for clarity, but put that same set
I showed on the 3-minute chart last time on this action, and see how that set
is still being used."
 And from Wednesday: And from Wednesday:

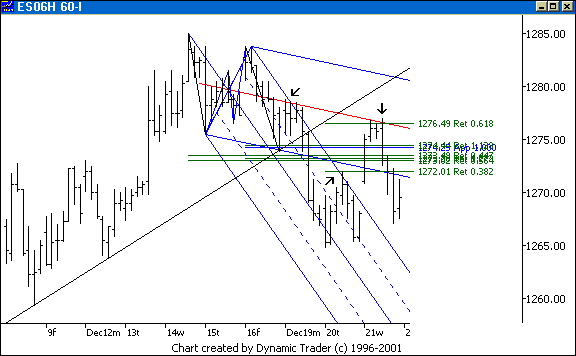
 "The second arrow shows a .382 I added on to
yesterday's action, just to make sure you all saw that. Now, look at what the
ES did today. You see the (deleted for free commentary, sorry) ABCD completing
at a .618 retracement, right back at that ML again? Is this a sell spot, or
what? How obvious is this, I mean, within the 'context' of my methodology? I
can just sit back and wait for things like this to come together. If they
don't, I read comic books and wait (that's a joke). "The second arrow shows a .382 I added on to
yesterday's action, just to make sure you all saw that. Now, look at what the
ES did today. You see the (deleted for free commentary, sorry) ABCD completing
at a .618 retracement, right back at that ML again? Is this a sell spot, or
what? How obvious is this, I mean, within the 'context' of my methodology? I
can just sit back and wait for things like this to come together. If they
don't, I read comic books and wait (that's a joke).
 Let's look at
the ES on a 5-minute chart. Let's look at
the ES on a 5-minute chart.

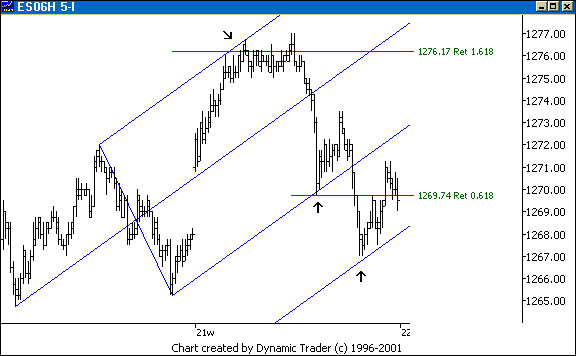
 Here's a 'standard' ML set. The ES does a
(deleted for free commentary, sorry) ABCD, right at a 1.618 and that upper //.
Ah, but what is right here? Go back to the 60-minute chart: that downsloping ML
from the modified Schiff ML set. It was too hard for me to add on here, but on
my working charts on QCharts, which holds the lines as I switch timeframes, had
it right there. The high by the arrow hit dead on the intersection of the two
lines, giving me the time factor. It then went sideways and they did a stop
run, but that was no threat to this play based on the traded timeframe setup if
I was in already on a low confirmation entry trigger. Look at how this set,
with the warning line, was 'seen'. This is so nice." Here's a 'standard' ML set. The ES does a
(deleted for free commentary, sorry) ABCD, right at a 1.618 and that upper //.
Ah, but what is right here? Go back to the 60-minute chart: that downsloping ML
from the modified Schiff ML set. It was too hard for me to add on here, but on
my working charts on QCharts, which holds the lines as I switch timeframes, had
it right there. The high by the arrow hit dead on the intersection of the two
lines, giving me the time factor. It then went sideways and they did a stop
run, but that was no threat to this play based on the traded timeframe setup if
I was in already on a low confirmation entry trigger. Look at how this set,
with the warning line, was 'seen'. This is so nice."
 I hope it is
clearer what I was getting at about using all my tools to look over and
evaluate a framework and choose potential trades from within that. Many times I
have an idea what price action may do at an area, but that doesn't necessarily
mean I plan to trade there. I am looking for the best setups to trade, and I
use the other areas to see how well the price action follows what I expect.
That gives me information I can use to evaluate the setups I do want to trade.
Here my bias was more towards this acting like a 'wave 3' than a CD leg (wave
c, for you Elliot people) off that initial ABCD area from last week's
chart, so I was looking for short setups. Things unfolding in the Russell gave
me a lot of clues here, too. I hope it is
clearer what I was getting at about using all my tools to look over and
evaluate a framework and choose potential trades from within that. Many times I
have an idea what price action may do at an area, but that doesn't necessarily
mean I plan to trade there. I am looking for the best setups to trade, and I
use the other areas to see how well the price action follows what I expect.
That gives me information I can use to evaluate the setups I do want to trade.
Here my bias was more towards this acting like a 'wave 3' than a CD leg (wave
c, for you Elliot people) off that initial ABCD area from last week's
chart, so I was looking for short setups. Things unfolding in the Russell gave
me a lot of clues here, too.
 Let's wrap up with a follow up on EBAY, which we looked
at last week. I'll show this on the 130-minute timeframe. Let's wrap up with a follow up on EBAY, which we looked
at last week. I'll show this on the 130-minute timeframe.

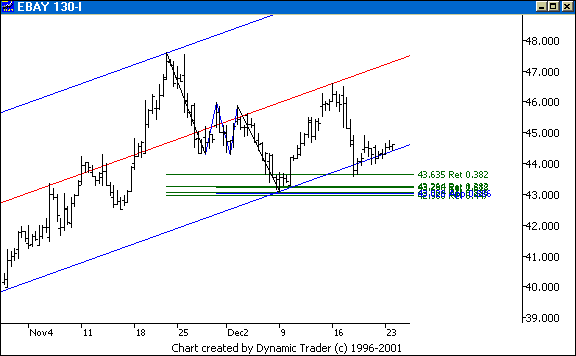
 Recall how I mentioned that EBAY was
approaching that median line? Look at what happened from there. EBAY rolled
right off that line, and went right down to that lower parallel, which it has
been tracking up since. I call this 'trendline creep', and I have some
techniques based on that. The point here is just look at how this set was
'seen' by EBAY. Look at the clean reaction off the pattern, grouping and line
area, and how the behavior since then has been very 'unsurprising'. This set
and groupings were on my chart well before the ABCD reversal, and I posted the
chart in here before the last two line interactions. It is price action like
this that led to the development of essentially my entire methodology. Recall how I mentioned that EBAY was
approaching that median line? Look at what happened from there. EBAY rolled
right off that line, and went right down to that lower parallel, which it has
been tracking up since. I call this 'trendline creep', and I have some
techniques based on that. The point here is just look at how this set was
'seen' by EBAY. Look at the clean reaction off the pattern, grouping and line
area, and how the behavior since then has been very 'unsurprising'. This set
and groupings were on my chart well before the ABCD reversal, and I posted the
chart in here before the last two line interactions. It is price action like
this that led to the development of essentially my entire methodology.
 I hope
everyone enjoys their holiday time, and takes some time off to be with friends
and family. The market is a lot of fun, and can be very compelling, as far as
spending time working on it. Never forget the importance of family, something I
think all of us serious market students tend to do too often. I am going to
turn my computer off now and rejoin the get-together going on in the next room,
and not think about trading until tomorrow (even though the market is closed
until Tuesday). I suggest you do the same. I hope
everyone enjoys their holiday time, and takes some time off to be with friends
and family. The market is a lot of fun, and can be very compelling, as far as
spending time working on it. Never forget the importance of family, something I
think all of us serious market students tend to do too often. I am going to
turn my computer off now and rejoin the get-together going on in the next room,
and not think about trading until tomorrow (even though the market is closed
until Tuesday). I suggest you do the same.
 The next commentary will be next
weekend's edition, posted by Sunday evening, January 1, 2006 (in the New
Year!), or since that's also a holiday, maybe just before or after then. The next commentary will be next
weekend's edition, posted by Sunday evening, January 1, 2006 (in the New
Year!), or since that's also a holiday, maybe just before or after then.
 |
|
|
| |
|
|
 NOTE: Reading this page or
any page on the Kane Trading website, or utilizing this website and any
material NOTE: Reading this page or
any page on the Kane Trading website, or utilizing this website and any
material
contained herein in any way, shall constitute an
acknowledgment that you have read, understood and agreed
to all
the disclaimers,
terms & conditions, and
policies of this site.
 |
|
 This
website is best viewed with MSIE 6.0, text size set to medium, and screen
resolution set to 1024 by 768.
 Copyright
© 2005 Kane Trading. All rights reserved. Copyright
© 2005 Kane Trading. All rights reserved.
 |
|


