|
|
| |
|
 November
13, 2005 Commentary (weekend edition)- November
13, 2005 Commentary (weekend edition)-
Well, I'm
sure I'm sounding just like a broken record, but I am finding this market just
fantastic for trading. Maybe it is just that the rhythm and pace suit me and my
methodology quite well, I'm not sure. I just know that complaining about the
action is something that I don't feel the urge to do too often. I spend every
minute of every trading day, pretty much, focusing on the mini's, especially
the Russell. I then spend the rest of the time I can come up with on various
futures, FX, and some index and sector work, which I play via ETF's or possibly
strong leading components in that arena.
The point is I am finding the
action downright great in everything, across the board. Sure, I have to hunt up
the setups and see what's 'in play' at any given time, but I'm finding what I
consider fantastic potential opportunities from the mini tick charts up to
weekly setups in commodities or stocks, for example. As I have said many, many
times I am not saying this in a vain attempt to brag, but to point out that I
feel this is simply a superb market for me to work my methodology. The question
isn't can I find the setups; it's which setups do I filter out in favor of
better setups.
Let's look at last week's Jim's Chart of the Week, and then we'll
look at a few things from this past week.
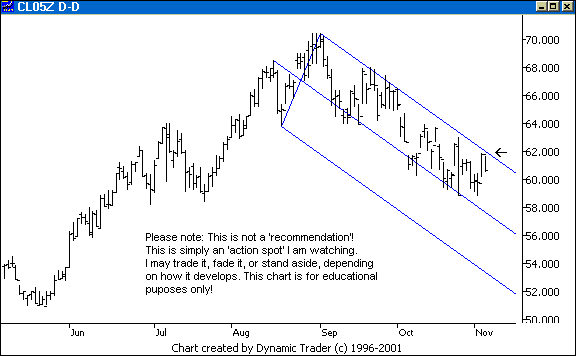
Here's the chart I posted last weekend. I was
watching this area at the median line upper parallel very closely, as crude has
obviously been using this set quite well for some time. I wanted to see how it
reacted here, and whether it rolled over, or rolled down a bit and set up, say,
a small ABCD to launch it over the line. This would indicate to me that the
downtrend may be over. Let's see what happened.
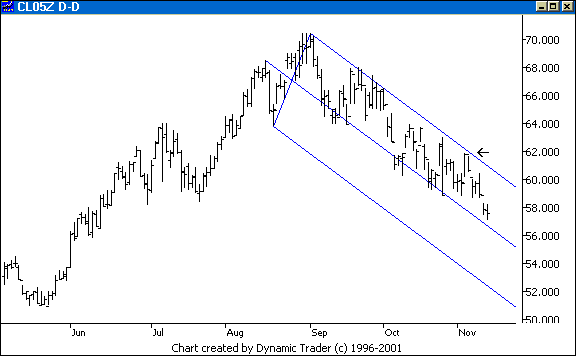
Crude just rolled right over and kept moving
down. There was no indication of any kind that it was setting up an ABCD, no
less triggering off of one. That's one way I 'read' the action. Sometimes there
are very few clues. I look for the times when there are clues. In this case the
trend was down, so taking a short off that median line upper parallel would be
something I would be looking at. The point is, since this has been moving down
for a while, I want to watch for clues that crude was planning to take the line
out. I didn't see any, so I would manage accordingly.
If I see
something like an ABCD, maybe completing at a division line, I factor that in
to my management plan, and based on the reaction, I may close and get long,
depending on my overall assessment. I am hoping to show each week how I look at
various layouts, and how I try to use the information. One thing is for sure,
once again I did point to an action spot that produced 'action'.
Let's look at
something I showed in the members' section on
Wednesday. I mentioned it before then, but I didn't do the follow up until
then. I will quote from there, but I will add the data from the rest of the
week onto the charts.
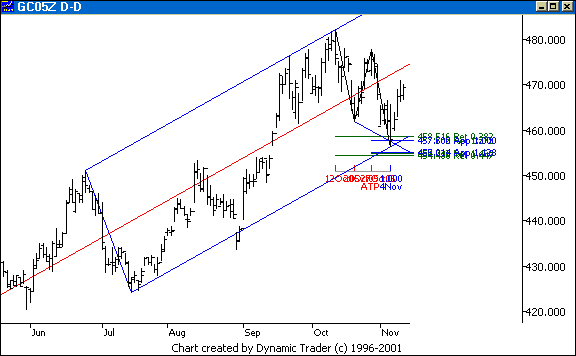
"Here is my setup on gold that I mentioned a
little while back. Nice ABCD at the lower // for an 'adjusted' set. There is
time symmetry, a .382 grouping, and that line there is the lower // of a
modified Schiff ML set. It all came together, and gold reacted nicely off the
area.
Let's drop down to a 15-minute chart to see the reaction.
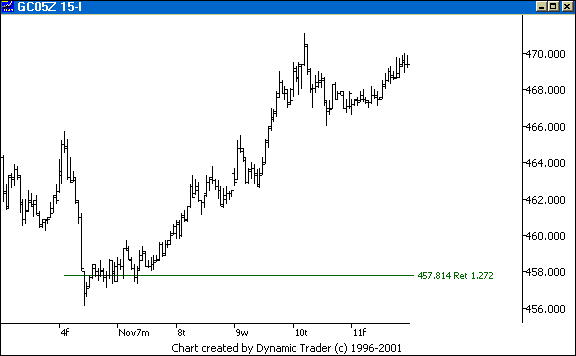
Gold plunges down into the PTA, in a move
that I like to see, as it scares most potential longs away. I showed a 1.272
retracement of that last move down. It hit right in the area, so you can use
that to see where I was getting ready. This is as clean and smooth of price
action as I could want in a PTA. There were endless entry triggers, especially
that 4-Point Continuation
Pattern right before it took off. The completion point was a little
above the .786, but the price action was clear. As I say: 'this is as good as
it gets for me'. The setup and entry trigger was just clear as can be for me.
This is what I'm always looking for. Now we see if it follows through, as that
will have greater implications for my analysis."
Let's look at another thing I've
been discussing these past few weeks. I am trying to show some things that
aren't just straight up setup based, things where I do some analysis and some
thinking out loud. This is from Tuesday's commentary.
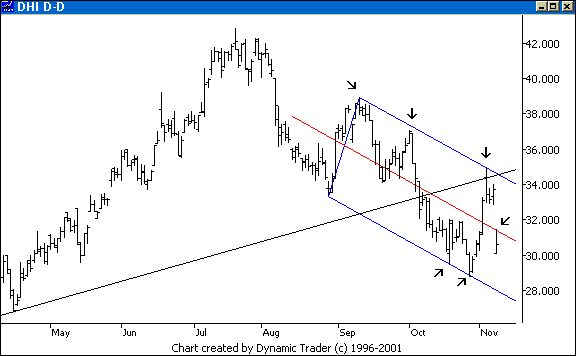
"Recall I showed DHI on the weekly chart.
Here it is on the daily chart, with a modified Schiff ML set. The set was on
the chart at the first arrow. Look at how the set has been used. DHI rolled
right off the upper //, 'testing' that weekly trendline in black from below.
Notice the high for today at the ML. The point here is that they say the
housing stocks are done, completely toast. There is a big ABCD in this sector,
and nothing here has invalidated that yet. So far the behavior is still very
orderly. I'm not saying I think the ABCD will play out, only that the technical
evidence doesn't show what they are saying on television."
Let's look at
DHI as it sits now.
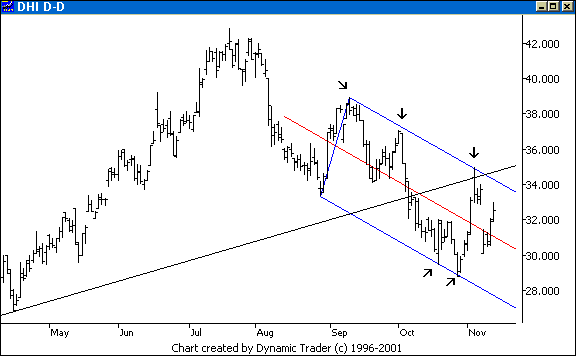
DHI continued up. Take a look at this one,
and as many others as you can stand from the homebuilders. Look at that weekly
pattern. Look at BZH, which I also discussed in the members' area, and see if
you can see what I pointed out there that it came right off of. Look at the
sector index and an ETF like IYR, which just took out a key trendline.
It's a bit
tough to follow along fully when you only have one small part of the entire
'conversation' and only some of the 'context' and intermarket analysis, but you
should be able to get the idea. A lot of my work and analysis is well outside
of just the potential trade area (PTA, i.e. 'the setup').
This is tied
to interest rates, which I monitor with treasuries, among other things. That's
tied to currencies, which I follow in the futures and FX markets. That relates
to gold, which I follow. And so on, and so on. Mix in sentiment, commercial
activity, 'context', multiple timeframe analysis, etc., and the picture can
frequently become quite clear (and when it's not, I stand aside). It is via
this approach that I have an idea when I want to 'trade it, fade it, or stand
aside'.
The next commentary will be next weekend's edition, posted by
Sunday evening, November 20, 2005.
|
|
|
| |
|
|
 NOTE: Reading this page or
any page on the Kane Trading website, or utilizing this website and any
material NOTE: Reading this page or
any page on the Kane Trading website, or utilizing this website and any
material
contained herein in any way, shall constitute an
acknowledgment that you have read, understood and agreed
to all
the disclaimers,
terms & conditions, and
policies of this site.
|
|
|
This
website is best viewed with MSIE 6.0, text size set to medium, and screen
resolution set to 1024 by 768.
Copyright
© 2005 Kane Trading. All rights reserved.
|
|

