|
|
| |
|
 August
27, 2006 Commentary (weekend edition)- August
27, 2006 Commentary (weekend edition)-
 Boy, am I
having a blast. The volume is light, the interest in the market seems to
continue to wane, and I find the action more than I could ask for. Nothing like
being the only kid in the candy store, and the shelves are overflowing with
choices? I only drone on and on about this because I simply don't get it. I
mean, if the market seemed to have little, or no, potential opportunities,
well, then I could see the lack of interest, but I can't recall seeing so many
nice-looking setups. Ah, well, mine is not to understand this, only to observe
it. Boy, am I
having a blast. The volume is light, the interest in the market seems to
continue to wane, and I find the action more than I could ask for. Nothing like
being the only kid in the candy store, and the shelves are overflowing with
choices? I only drone on and on about this because I simply don't get it. I
mean, if the market seemed to have little, or no, potential opportunities,
well, then I could see the lack of interest, but I can't recall seeing so many
nice-looking setups. Ah, well, mine is not to understand this, only to observe
it.
 I
have a few quick items to discuss, and then we'll get to work, because I have a
full plate of things 'on deck' for today. I will try to stay somewhat with the
current theme, as I got a lot of absolutely spectacular feedback about last
week's commentary. Thanks to all on that. I will be updating the testimonials page some time this
weekend, so be sure to check that out a little later. I expect to update the
mentorship page and add a 'sub-page' soon, perhaps by next weekend. I will also
explain some of the 'mysterious' personal lifestyle change stuff I have been
alluding to at that point, and maybe start to throw out small stories here and
there. I've been told my stories are fun, so if I feel inspired I'll toss some
out there. I
have a few quick items to discuss, and then we'll get to work, because I have a
full plate of things 'on deck' for today. I will try to stay somewhat with the
current theme, as I got a lot of absolutely spectacular feedback about last
week's commentary. Thanks to all on that. I will be updating the testimonials page some time this
weekend, so be sure to check that out a little later. I expect to update the
mentorship page and add a 'sub-page' soon, perhaps by next weekend. I will also
explain some of the 'mysterious' personal lifestyle change stuff I have been
alluding to at that point, and maybe start to throw out small stories here and
there. I've been told my stories are fun, so if I feel inspired I'll toss some
out there.
 Let's get started on the charts. Last week's chart of
the week on crude is also this week's chart of the week, since it is still in
the area, and still of critical importance. Those that have the full set will
clearly see the pattern this has done right at the critical area. It doesn't
get any more interesting that this. Watch this like a hawk. For now, let's
start with a follow-up on the 10-year index. Let's get started on the charts. Last week's chart of
the week on crude is also this week's chart of the week, since it is still in
the area, and still of critical importance. Those that have the full set will
clearly see the pattern this has done right at the critical area. It doesn't
get any more interesting that this. Watch this like a hawk. For now, let's
start with a follow-up on the 10-year index.

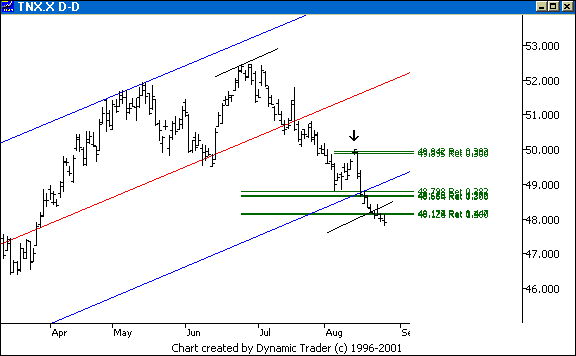
 The arrow shows the area we were last
discussing. Rates have continued to fall right off this area. Notice the two
areas I wanted to keep an eye on from the bigger set. I added an offset line
that complements the lower area nicely. For the most part, rates haven't had
much respect for these areas. That's why I emphasize entry techniques so strongly as an
integrated part of my entire comprehensive 'Trading Plan', and why I went to
full set only books sales. I worked hard to come up with an entire plan that
all fits together, where all the pieces are necessary to the greater
whole. The arrow shows the area we were last
discussing. Rates have continued to fall right off this area. Notice the two
areas I wanted to keep an eye on from the bigger set. I added an offset line
that complements the lower area nicely. For the most part, rates haven't had
much respect for these areas. That's why I emphasize entry techniques so strongly as an
integrated part of my entire comprehensive 'Trading Plan', and why I went to
full set only books sales. I worked hard to come up with an entire plan that
all fits together, where all the pieces are necessary to the greater
whole.
 So, for now, my play is short, and is in 'ride' and management
mode. But, I can hear you asking, doesn't it bother you that this didn't even
see such a key area? No, I don't care about that for several reasons. First,
many areas don't show reactions. That's why entry techniques are so critical,
and why I just can't be a 'fader'. Next, if my play here is short for the time
being, I'm quite happy if this keeps going down here. But why would I short
with such solid 'support' right below? So, for now, my play is short, and is in 'ride' and management
mode. But, I can hear you asking, doesn't it bother you that this didn't even
see such a key area? No, I don't care about that for several reasons. First,
many areas don't show reactions. That's why entry techniques are so critical,
and why I just can't be a 'fader'. Next, if my play here is short for the time
being, I'm quite happy if this keeps going down here. But why would I short
with such solid 'support' right below?
 Well, first off, I might be thinking of a
trade just to the area. Then if I don't see a reaction and this bigger area
'goes', I might get a big 'runner'. And if the area is reached, I at least have
a lower timeframe trade, and plenty to work with. Alas, though, the bigger
picture tells me something. And what is that? C'mon, now, you know this one.
'Context'. What is the
'context' here? Surely, you recall the work I showed on the higher
timeframes. Well, first off, I might be thinking of a
trade just to the area. Then if I don't see a reaction and this bigger area
'goes', I might get a big 'runner'. And if the area is reached, I at least have
a lower timeframe trade, and plenty to work with. Alas, though, the bigger
picture tells me something. And what is that? C'mon, now, you know this one.
'Context'. What is the
'context' here? Surely, you recall the work I showed on the higher
timeframes.
 Let's jump up to the monthly chart on this one. Let's jump up to the monthly chart on this one.

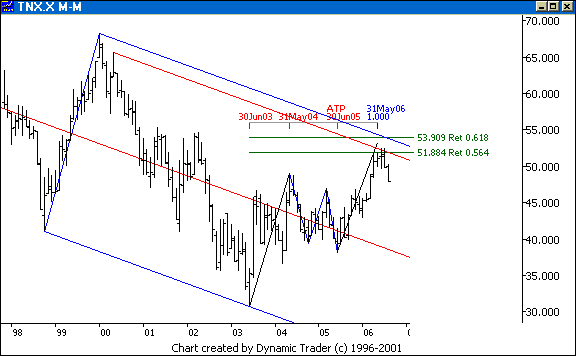
 Oh, my, Jim, that's interesting. Yes, this is
the 'bigger picture' I have been watching. It would be very normal and usual
for this to bounce off the area in the last chart, even if this scenario here
is to play out. It would also be very common and usual for this to drop in here
and then hit a 'trend retracement' area and head back up to either the median
line upper parallel, or to 'blow out' the setup here. Oh, my, Jim, that's interesting. Yes, this is
the 'bigger picture' I have been watching. It would be very normal and usual
for this to bounce off the area in the last chart, even if this scenario here
is to play out. It would also be very common and usual for this to drop in here
and then hit a 'trend retracement' area and head back up to either the median
line upper parallel, or to 'blow out' the setup here.
 The point is,
I am watching very specific areas, ones that are similar in layout (fractal in
nature, again), on all the timeframes, to get clues as to what I think the
intention is with rates. We are, again, approaching a critical decision making
point. As I have said in here before, I would trade this via the electronic
10-year, the ZN. Go back and look on a tick chart to see just how nicely this
took off from that last area on the report news. How sweet was that? The point is,
I am watching very specific areas, ones that are similar in layout (fractal in
nature, again), on all the timeframes, to get clues as to what I think the
intention is with rates. We are, again, approaching a critical decision making
point. As I have said in here before, I would trade this via the electronic
10-year, the ZN. Go back and look on a tick chart to see just how nicely this
took off from that last area on the report news. How sweet was that?
 Let's move on
to some hardcore work on the Russell mini. Keep in mind, as detailed as this is
(and in my opinion, this is extraordinarily detailed for a free commentary), I
am only showing a very small fraction of what I am seeing. If I were working
one-on-one with someone here I could easily spend half a day just on this
example and still have things left to discuss. Let's go back to last
week. Let's move on
to some hardcore work on the Russell mini. Keep in mind, as detailed as this is
(and in my opinion, this is extraordinarily detailed for a free commentary), I
am only showing a very small fraction of what I am seeing. If I were working
one-on-one with someone here I could easily spend half a day just on this
example and still have things left to discuss. Let's go back to last
week.

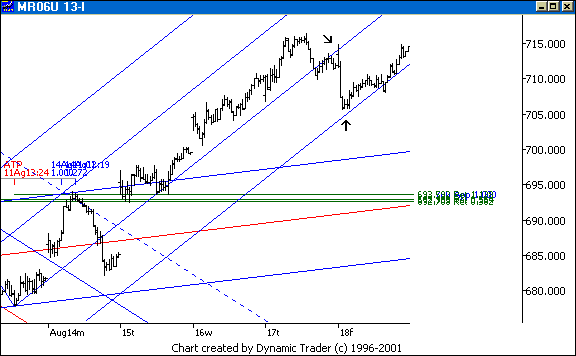
 Recall this example from last week. We
stopped our coverage right at the peak on this chart. I wanted to mention one
thing on this last week, but I forgot. That gave me a good excuse to revisit
this. Notice how the MR followed the slope of this set all the way up to the
high. Sometimes the sets give me not only my areas, but also they 'guide' the
price action, as far as 'pace' or 'rate' of incline or decline. Recall this example from last week. We
stopped our coverage right at the peak on this chart. I wanted to mention one
thing on this last week, but I forgot. That gave me a good excuse to revisit
this. Notice how the MR followed the slope of this set all the way up to the
high. Sometimes the sets give me not only my areas, but also they 'guide' the
price action, as far as 'pace' or 'rate' of incline or decline.
 Now, once I
am here on this one, look what happened right after where we left off. The MR
breaks that lower parallel, tracks it on the underside with an ABCD, shown at
the first arrow, and then it rolls down to a warning line I added on for this
week's commentary, in an ABCD with an ABCD in the BC leg. This brings us to the
second arrow, where the MR start right up. Do some additional line work here,
and the Fibs, and you'll see something amazing. From area to area to area, from
setup to setup to setup. We will look at this a bit more shortly. Now, once I
am here on this one, look what happened right after where we left off. The MR
breaks that lower parallel, tracks it on the underside with an ABCD, shown at
the first arrow, and then it rolls down to a warning line I added on for this
week's commentary, in an ABCD with an ABCD in the BC leg. This brings us to the
second arrow, where the MR start right up. Do some additional line work here,
and the Fibs, and you'll see something amazing. From area to area to area, from
setup to setup to setup. We will look at this a bit more shortly.
 Let's look at
a basic trendline technique on the higher timeframe 135-minute chart that gave
me something to watch this past week. Let's look at
a basic trendline technique on the higher timeframe 135-minute chart that gave
me something to watch this past week.

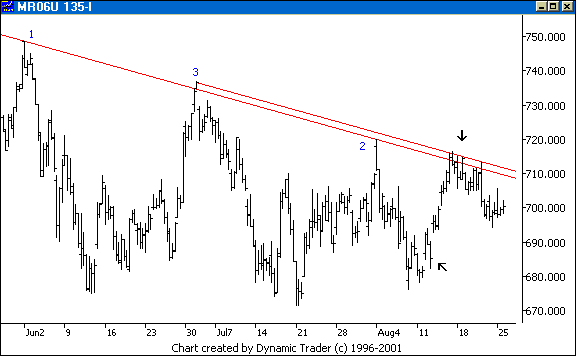
 Well before the week got under way I had some
trendlines on my chart from way back. I anchored one line using the points
marked 1 and 2. I then cloned the line and put a 'sliding parallel' anchored
off point 3. This gave me a little zone to keep an eye on, and that was
available to me back at point 2. The lower arrow is from last week, in the area
we were discussing. The second arrow shows the price action and behavior at the
zone. Very curious, huh? Notice the 'context' we looked at last week,
too. Well before the week got under way I had some
trendlines on my chart from way back. I anchored one line using the points
marked 1 and 2. I then cloned the line and put a 'sliding parallel' anchored
off point 3. This gave me a little zone to keep an eye on, and that was
available to me back at point 2. The lower arrow is from last week, in the area
we were discussing. The second arrow shows the price action and behavior at the
zone. Very curious, huh? Notice the 'context' we looked at last week,
too.
 Let's drop down to the 13-minute chart and look at one of the
seemingly almost endless setups that keep forming. Let's drop down to the 13-minute chart and look at one of the
seemingly almost endless setups that keep forming.

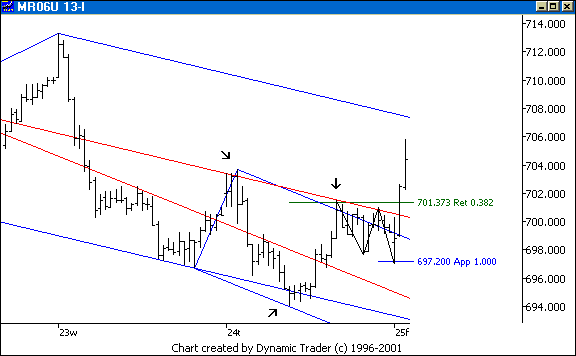
 I have a bigger median line set on here, one
of my 'adjusted' sets from Kane
Trading on: Median Line and Fibonacci Synergy. The first two arrows
show how the set was 'seen' and where potential opportunities arose for me. The
third arrow shows yet another potential area I was watching. I have a bigger median line set on here, one
of my 'adjusted' sets from Kane
Trading on: Median Line and Fibonacci Synergy. The first two arrows
show how the set was 'seen' and where potential opportunities arose for me. The
third arrow shows yet another potential area I was watching.
 This is not
only a key line area, but one of my patterns right there, right at a key .382
retracement. The smaller set also supports this area. But the MR rolls off the
area in an ABCD. I showed the 1.000 price projection for that. Do the
additional line work for this, on the ABCD as well as division lines and such.
Impressive area, huh? The MR triggers right off that ABCD, and I'm thinking a
bigger ABCD may be forming. I need to do some work and see where I may want to
watch for that, as well as look to play this leg. I love to play CD legs of
ABCD's, especially when the BC leg has an ABCD. This is not
only a key line area, but one of my patterns right there, right at a key .382
retracement. The smaller set also supports this area. But the MR rolls off the
area in an ABCD. I showed the 1.000 price projection for that. Do the
additional line work for this, on the ABCD as well as division lines and such.
Impressive area, huh? The MR triggers right off that ABCD, and I'm thinking a
bigger ABCD may be forming. I need to do some work and see where I may want to
watch for that, as well as look to play this leg. I love to play CD legs of
ABCD's, especially when the BC leg has an ABCD.
 I'll add quite a bit to the chart,
and we'll assess that. I'll add quite a bit to the chart,
and we'll assess that.

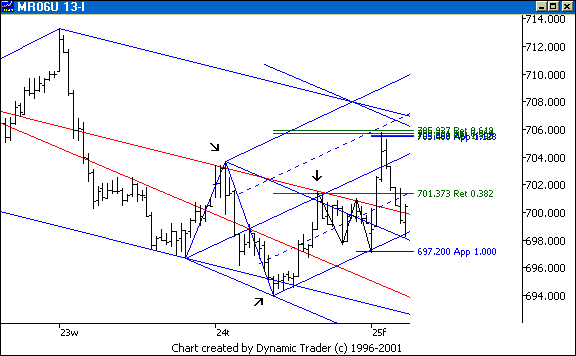
 I found one very tight grouping area to watch
that fell below the major line area I saw above. I added a 'standard' median
line set onto the chart, as well as a warning line for the smaller downsloping
set. I had a grouping up there, but didn't show it for clarity. That one
extended the ABCD quite a bit, and that 'standard' set upper division line
hitting right at the grouping shown here really intrigued me. Not only that, do
an offset line from the area of the lowest arrow and see what that tells
you. I found one very tight grouping area to watch
that fell below the major line area I saw above. I added a 'standard' median
line set onto the chart, as well as a warning line for the smaller downsloping
set. I had a grouping up there, but didn't show it for clarity. That one
extended the ABCD quite a bit, and that 'standard' set upper division line
hitting right at the grouping shown here really intrigued me. Not only that, do
an offset line from the area of the lowest arrow and see what that tells
you.
 Point is, once this area was hit I wanted to watch for triggers and
be ready to go. If it got to the upper lines, fine, but if this was the spot, I
wanted to be ready. And this was, indeed, the spot. Notice the plunge, right to
a very obvious line intersection. Now, I would normally be done with this
example here, given how much 'over budget' I am with time and space in here now
(even though I feel frustrated with how little I have shown of what I see), but
I have to show one more thing, or I'll be doing it next week. Point is, once this area was hit I wanted to watch for triggers and
be ready to go. If it got to the upper lines, fine, but if this was the spot, I
wanted to be ready. And this was, indeed, the spot. Notice the plunge, right to
a very obvious line intersection. Now, I would normally be done with this
example here, given how much 'over budget' I am with time and space in here now
(even though I feel frustrated with how little I have shown of what I see), but
I have to show one more thing, or I'll be doing it next week.
 Let's go with
another bonus chart again today, and go back to last week's chart. Let's go with
another bonus chart again today, and go back to last week's chart.

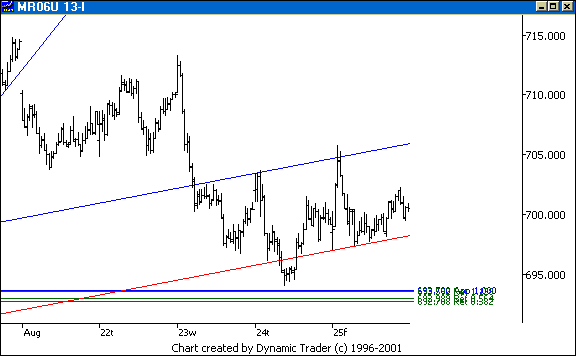
 The peak on the left is where that run from
last week ended, and where I stopped on chart 3 from today. Notice what this
did with one of the sets from last week. It dropped right down and started
working the lines from that set. Notice how this provided 'boundaries' of sorts
for the action we just looked at. So, in addition to all that we just covered,
this was going on. See one more reason why I was watching the lower area (at my
grouping on the last chart) so closely? Put a division line on this for even
more fun. See why I can't comprehend why the volume is so low and few people
are left trading? I just don't get it. The peak on the left is where that run from
last week ended, and where I stopped on chart 3 from today. Notice what this
did with one of the sets from last week. It dropped right down and started
working the lines from that set. Notice how this provided 'boundaries' of sorts
for the action we just looked at. So, in addition to all that we just covered,
this was going on. See one more reason why I was watching the lower area (at my
grouping on the last chart) so closely? Put a division line on this for even
more fun. See why I can't comprehend why the volume is so low and few people
are left trading? I just don't get it.
 I hope everyone enjoyed today's commentary
and got a lot out of it. I really 'busted my hump' doing all this, and I am
getting some comments lately asking how I can stand to do such long, detailed
commentary, especially for free. I guess everyone in here just benefits from my
perfectionistic, high-quality nature, because I can't stand to do anything less
than 'my best'. It's a bit crazy that I can do a presentation like this, all
for free, and walk away feeling it is not near as detailed as I would like.
That was a big part of moving to full set sales. I really didn't like people
seeing only a part of my work, especially given how I feel it is all part of a
greater, holistic whole, where all the parts were designed to fit and work
together. I hope everyone enjoyed today's commentary
and got a lot out of it. I really 'busted my hump' doing all this, and I am
getting some comments lately asking how I can stand to do such long, detailed
commentary, especially for free. I guess everyone in here just benefits from my
perfectionistic, high-quality nature, because I can't stand to do anything less
than 'my best'. It's a bit crazy that I can do a presentation like this, all
for free, and walk away feeling it is not near as detailed as I would like.
That was a big part of moving to full set sales. I really didn't like people
seeing only a part of my work, especially given how I feel it is all part of a
greater, holistic whole, where all the parts were designed to fit and work
together.
 Well, that's all for now. Watch crude, and those treasuries, as
well as gold and the metals, and the currencies. It's really showtime. And look
at WY for fun, and see if you see anything there. Well, that's all for now. Watch crude, and those treasuries, as
well as gold and the metals, and the currencies. It's really showtime. And look
at WY for fun, and see if you see anything there.
 The next commentary will be next
weekend's edition, posted by Sunday evening, September 3, 2006. The next commentary will be next
weekend's edition, posted by Sunday evening, September 3, 2006.
 |
|
|
| |
|
|
 NOTE: Reading this page or
any page on the Kane Trading website, or utilizing this website and any
material NOTE: Reading this page or
any page on the Kane Trading website, or utilizing this website and any
material
contained herein in any way, shall constitute an
acknowledgment that you have read, understood and agreed
to all
the disclaimers,
terms & conditions, and
policies of this site.
 |
|
 This
website is best viewed with MSIE 6.0, text size set to medium, and screen
resolution set to 1024 by 768.
 Copyright
© 2006 Kane Trading. All rights reserved. Copyright
© 2006 Kane Trading. All rights reserved.
 |
|


