|
|
| |
|
 February 2, 2004
Commentary- February 2, 2004
Commentary-
 Today was one of the best days for intraday
trading the ES mini that I have seen in a long while. It was better than my
wildest expectations, given Friday's rather muted action. Although there were
some setups that were just classic to the nth degree, I want to focus on the
management end of the trade in today's commentary. Today was one of the best days for intraday
trading the ES mini that I have seen in a long while. It was better than my
wildest expectations, given Friday's rather muted action. Although there were
some setups that were just classic to the nth degree, I want to focus on the
management end of the trade in today's commentary.
 Let me start
out with my strategy. After Friday's failure to take the market down
substantially, and the constant bearish 'we're gonna correct in here now' from
every source that I saw, I was thinking I needed to be looking for long
opportunities, if I got the set ups. We gapped open, ran up a little, and
started to sell down. This was starting to look good for my plan. Let me start
out with my strategy. After Friday's failure to take the market down
substantially, and the constant bearish 'we're gonna correct in here now' from
every source that I saw, I was thinking I needed to be looking for long
opportunities, if I got the set ups. We gapped open, ran up a little, and
started to sell down. This was starting to look good for my plan.
 Then I saw a
near perfect 4-Point Continuation
Pattern form on the 3-min chart. I checked the NQ and it had one, too.
This pointed to possible downside continuation. But we were headed to an area I
felt was very critical if they were going to come in for this thing. Now
what? Then I saw a
near perfect 4-Point Continuation
Pattern form on the 3-min chart. I checked the NQ and it had one, too.
This pointed to possible downside continuation. But we were headed to an area I
felt was very critical if they were going to come in for this thing. Now
what?
 This is where I feel I made a great call, as far as my battle plan.
I don't like to short just above support. But here was a unique opportunity. I
felt that the groupings that I had just below me were very critical. I felt
that this was a do or die situation in terms of whether or not we start a more
serious correction in here. So I saw a combination opportunity. This is where I feel I made a great call, as far as my battle plan.
I don't like to short just above support. But here was a unique opportunity. I
felt that the groupings that I had just below me were very critical. I felt
that this was a do or die situation in terms of whether or not we start a more
serious correction in here. So I saw a combination opportunity.
 The 4-Point
Continuation Pattern would allow me to take a downside shot with an extra tight
stop. I felt there was enough room before the groupings to at least take some
off in that area and have a winning, or breakeven, trade, if the groupings
held. But if they broke, I was positioned excellently, and I expected the move
to be sharp. The 4-Point
Continuation Pattern would allow me to take a downside shot with an extra tight
stop. I felt there was enough room before the groupings to at least take some
off in that area and have a winning, or breakeven, trade, if the groupings
held. But if they broke, I was positioned excellently, and I expected the move
to be sharp.
 If the groupings held, I would scale out and prepare to reverse. If
they planned to come in, this is where they would do it, and I expected that to
be a sharp move. If the groupings held, I would scale out and prepare to reverse. If
they planned to come in, this is where they would do it, and I expected that to
be a sharp move.
 Let me start with a 1-minute chart, showing the 4-Point
Continuation Pattern. The arrow marks the area where I went short. Let me start with a 1-minute chart, showing the 4-Point
Continuation Pattern. The arrow marks the area where I went short.

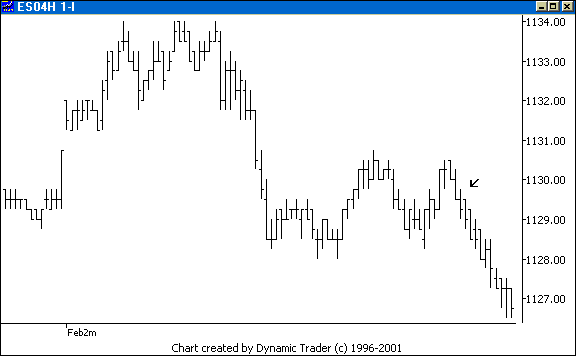
 I was able to scale out of some of the trade
by this point. We are now right on the grouping area. At this very instant the
NQ was completing a picture perfect 5-point pattern. Scott Carney over at Harmonic Trader called the NQ
pattern completion point with the precision of a renowned, highly skilled
neurosurgeon doing brain surgery with a laser scalpel. I was able to scale out of some of the trade
by this point. We are now right on the grouping area. At this very instant the
NQ was completing a picture perfect 5-point pattern. Scott Carney over at Harmonic Trader called the NQ
pattern completion point with the precision of a renowned, highly skilled
neurosurgeon doing brain surgery with a laser scalpel.
 I knew this
was it. The ES and NQ started to rise. I had a trendline on my chart that
defined for me the area the ES had to 'take out'. I'll show a 3-minute
chart. I knew this
was it. The ES and NQ started to rise. I had a trendline on my chart that
defined for me the area the ES had to 'take out'. I'll show a 3-minute
chart.

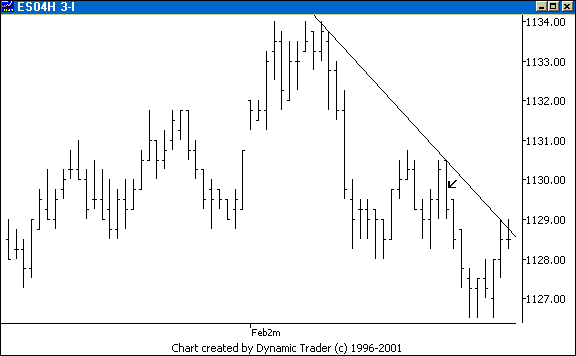
 The arrow points to the area where I went
short. At this point I'd been scaling out, so even if the ES went up I was
still going to have a winning trade here. I wanted to look for some type of
pullback or other entry once the trendline was violated. I didn't have
to wait long. The arrow points to the area where I went
short. At this point I'd been scaling out, so even if the ES went up I was
still going to have a winning trade here. I wanted to look for some type of
pullback or other entry once the trendline was violated. I didn't have
to wait long.

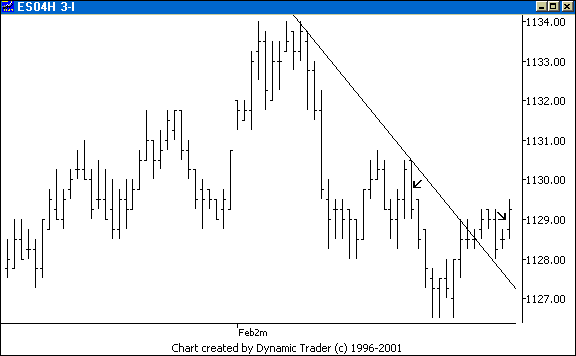
 I got a perfect pullback and
trigger. The second arrow points to the area where I got long. The short was a
winner, and I was now long. But the point wasn't to show my trade logic on this
sequence (although that in itself is worth looking at), but for me to point out
a management issue. I got a perfect pullback and
trigger. The second arrow points to the area where I got long. The short was a
winner, and I was now long. But the point wasn't to show my trade logic on this
sequence (although that in itself is worth looking at), but for me to point out
a management issue.
 Let's say I wanted to let this run, but if I got some
profits, I want to protect them. I want to run a fairly tight trailing stop
even for my first scale out. In other words, once the momentum slowed I wanted
to start taking profits. Let's say I wanted to let this run, but if I got some
profits, I want to protect them. I want to run a fairly tight trailing stop
even for my first scale out. In other words, once the momentum slowed I wanted
to start taking profits.
 I might choose a 1-bar trailing stop on the 3-minute (my
traded timeframe), combined with a 2 point ultimate trailing stop, in case we
get an expansion bar up and then a sharp reversal. (I wouldn't put the 2 point
trailing stop into effect until the move had 'taken off' and I had some decent
profits on the trade, realized or unrealized. I don't want to tighten up too
quickly.) What would have happened here? I might choose a 1-bar trailing stop on the 3-minute (my
traded timeframe), combined with a 2 point ultimate trailing stop, in case we
get an expansion bar up and then a sharp reversal. (I wouldn't put the 2 point
trailing stop into effect until the move had 'taken off' and I had some decent
profits on the trade, realized or unrealized. I don't want to tighten up too
quickly.) What would have happened here?

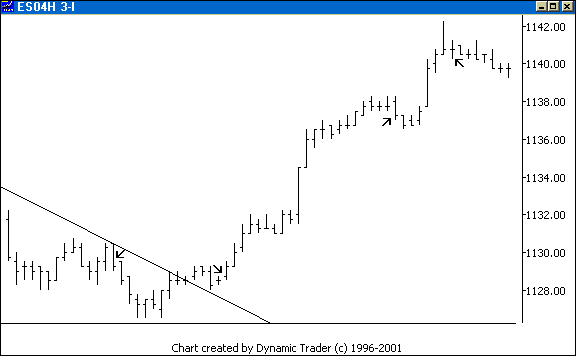
 Without counting inside bars (I don't), the first scale
out doesn't happen until the ES has moved 10.75 points off the bottom! This
spot is marked by the first arrow at the top right of the chart. The next scale
out was 13.75 points off the bottom, and was the final close of the trade also,
because it not only broke the 1-bar low, but it hit the 2-point trailing
stop. Without counting inside bars (I don't), the first scale
out doesn't happen until the ES has moved 10.75 points off the bottom! This
spot is marked by the first arrow at the top right of the chart. The next scale
out was 13.75 points off the bottom, and was the final close of the trade also,
because it not only broke the 1-bar low, but it hit the 2-point trailing
stop.
 This is a classic example of why I don't like, and rarely, if ever,
use, 'profit targets'. But it gets better. This area where the ES just hit
completed an ABCD pattern with an outstanding confluence. Although the ramp up
made me leery to think about a short trade, the ES behavior soon alleviated
that worry. A broad, rounding top started to form, and the ES started to look
weak. This is a classic example of why I don't like, and rarely, if ever,
use, 'profit targets'. But it gets better. This area where the ES just hit
completed an ABCD pattern with an outstanding confluence. Although the ramp up
made me leery to think about a short trade, the ES behavior soon alleviated
that worry. A broad, rounding top started to form, and the ES started to look
weak.
 Being aware that buy programs could hit at any second and that I
would have to cover fast, I went short. Since I want to focus on management and
not setups, I'll show the entire chart with the final move. Being aware that buy programs could hit at any second and that I
would have to cover fast, I went short. Since I want to focus on management and
not setups, I'll show the entire chart with the final move.

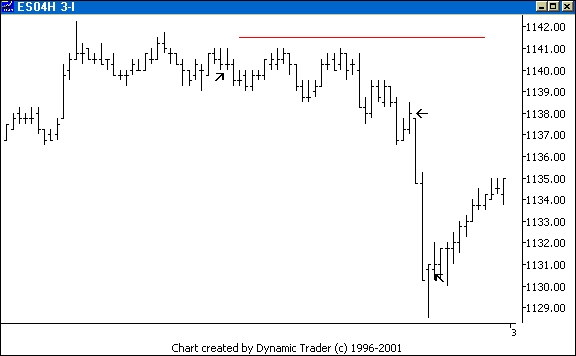
 The first arrow shows my entry, and the red horizontal
line my 1.75 point stop. The second arrow was the first scale out point for a
1-bar stop, initiated once the trade got going. (The pullback before this
second arrow was a potential spot to cover a partial position on the weakness,
but for me it was too early to use a bar stop.) The 2 point trailing stop would
not be in place yet. The third arrow represents where the trade came off on a 2
point trailing stop, which got hit before the next 1-bar high could be taken
out. The first arrow shows my entry, and the red horizontal
line my 1.75 point stop. The second arrow was the first scale out point for a
1-bar stop, initiated once the trade got going. (The pullback before this
second arrow was a potential spot to cover a partial position on the weakness,
but for me it was too early to use a bar stop.) The 2 point trailing stop would
not be in place yet. The third arrow represents where the trade came off on a 2
point trailing stop, which got hit before the next 1-bar high could be taken
out.
 These trades from today are just one case where effective
management could have greatly increased the trade potential. Most of the time I
don't see runs like this. Many times the results are similar to 'profit target'
strategies. I just don't see the downside to managing like this, at least not
for my trading, and on rare days like this, the upside is outstanding. I'm
showing this today to try to get everyone to think about their exit strategies,
and see if techniques like this, right out of Kane Trading on: Trailing Stops,
can be of some help. These trades from today are just one case where effective
management could have greatly increased the trade potential. Most of the time I
don't see runs like this. Many times the results are similar to 'profit target'
strategies. I just don't see the downside to managing like this, at least not
for my trading, and on rare days like this, the upside is outstanding. I'm
showing this today to try to get everyone to think about their exit strategies,
and see if techniques like this, right out of Kane Trading on: Trailing Stops,
can be of some help.
 |
|
|
| |
|
|
 NOTE: Reading this page or any page on the Kane
Trading website, or utilizing this website and any material NOTE: Reading this page or any page on the Kane
Trading website, or utilizing this website and any material
contained herein in any way, shall constitute an acknowledgement
that you have read, understood and agreed
to all the
disclaimers,
terms & conditions, and
policies of this site.
 |
|
 This website is best viewed with
MSIE 6.0, text size set to medium, and screen resolution set to 1024 by 768.
 Copyright © 2003 Kane
Trading. All rights reserved. Copyright © 2003 Kane
Trading. All rights reserved.
 |
|


