|
|
| |
|
 August
15, 2004 Commentary (weekend edition)- August
15, 2004 Commentary (weekend edition)-
Today I am
going to continue looking at the intraday ES. I am going to show three setups,
based on the ABCD pattern, that I found on Thursday and Friday. I didn't feel
that the ES (or the market in general) was acting all that well for intraday
trading, yet I found these three setups that yielded some potential trade
opportunities (I did find other setups, too, but I want to focus here on
utilizing the ABCD pattern, set up to continue the trend).
If you don't
trade the ES or intraday, don't just click off here. What I am showing here, in
my experience, applies to any liquid issue, on any timeframe, from tick charts
to monthly charts. It is the basis for a large part of my FOREX trading, and
any swing or position trading that I do. It doesn't matter how I show the
concepts, or in what issue/timeframe. The key aspect is that I show them, and
discuss what I am doing.
Let's look at something I saw on Thursday. I was so
excited with this one I wanted to do a special commentary just to point it out.
I contained myself and waited for today. I did call it live in the chat room,
but without a lot of the detail as to what I was seeing. If you have any
interest in checking out this chat room, run by Scott over at Harmonic Trader, send me an
e-mail. I'll ask Scott, on your behalf, if he will give you a free
trial.
I was looking at the ES for a short setup. Let's look at a
13-minute chart, showing what I was seeing at the point on Thursday when I was
noticing a setup coming together. I will add quite a bit of data onto the chart
to show more 'context', hence it won't be the clearest chart, but I need to
show more of the perspective. I can only post so many charts in here; otherwise
I'd show this on a 60-minute chart.
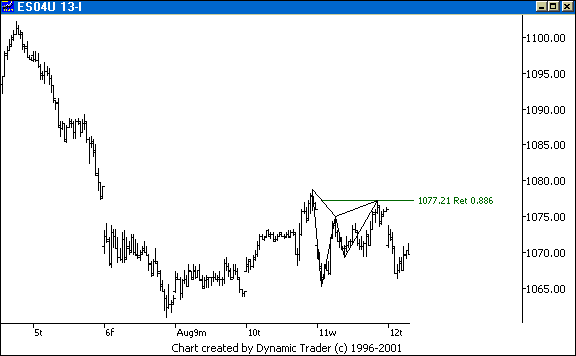
The ES had been trending down strongly, in
fact this chart only shows part of the run down, it had been coming down from
the 1108 area. A good-sized correction had unfolded on June 10, the last part
of which was the Tuesday play from the last commentary after the Fed
meeting.
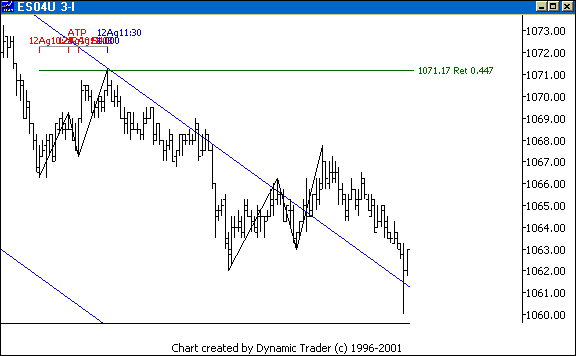
Then a 5-point pattern set up as a 'test' to this correction,
reversing right at the .886 retracement, to the tick. The ES dropped like a
rock, right into what looked like solid 'support'. It reversed up right near
another .886 retracement. Then I got a setup that shifted me to a short
bias.
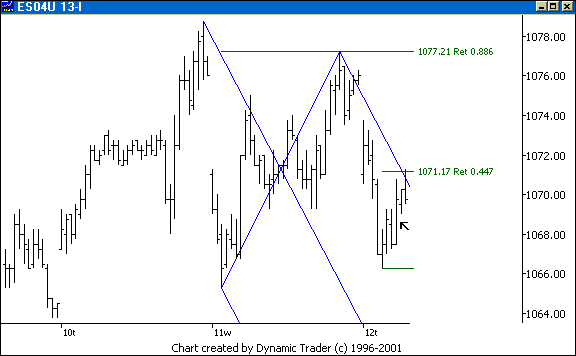
I removed the 5-point pattern lines for
clarity. I added on a median line and parallels, and the .447 retracement (it's
in Kane Trading on: Advanced
Fibonacci Trading Concepts). I had a potential trade area. The
correction had been tested, and the downtrend resumed. But, we were bouncing
off 'support'.
I was thinking that if they ran the stops, or just took that lower
area right out, this might run. The reward/risk was beginning to outweigh the
idea of 'shorting on support'. I had my 'context' for a potential trade. But I
wasn't interested at this point unless this pullback had structure. The arrow
shows the area that I needed to look at more closely. Let's drop down to a
3-minute chart for that.
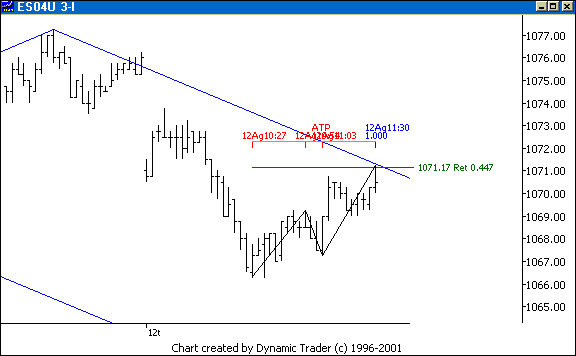
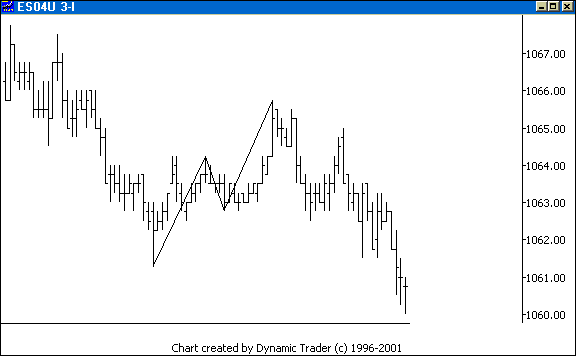
The ES formed a nice ABCD pattern, with
exactly equal time symmetry for the AB and CD legs. It all came together at my
potential trade area. (Understand that I had built a full grouping here, not
just this one number. Again, I am showing just the most salient
features.)
This was simply too good to pass up. Fibonacci, median
line parallel, time symmetry, and 'context'. Do I just jump in? Of course not,
I drop down to a lower timeframe and wait for an entry trigger. And I got one.
This keeps me out of trades that just blow right through the area. Let's see
how this did.
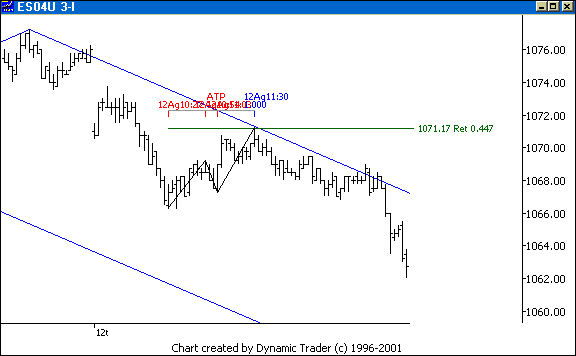
The ES dropped nicely, with plenty of
potential for profit. It reversed just after this chart was captured. It wasn't
a great run, but it was very good. And the short bias was the right read. I
wouldn't have wanted to be long, that's for sure. The overall trend was clearly
down in my eyes.
I'm going to throw in two more 'bonus' charts here. I expected to
have more time, and room, but the last play took up all the space for a normal
column. I saw two more nice ABCD setups, one on Thursday, and one on Friday.
I'll just show them here, with the run that occurred off them.
I'll set up
the charts showing the run at approximately the point it ended, so the maximum
trade potential can be seen. My main point is how often I see these, and, using
my methodology of Fibonacci, alternate projections, and 'context', how well
they do for me. I'll show these on the 3-minute timeframe.
That should look familiar. The next ABCD
pattern came together off the end off the last run. Some might see this as a
violation of that median line parallel, hence creating long bias. The trend was
down, and the setup clear to me (notice the 'overhead supply'?). I weighed it
all up and felt that the pattern was a good potential trade. It gave a nice
run. Let's look at one more.
This setup came together Friday afternoon.
Another good run, but not great. Depending on one's 'Trading Plan', the
pullback after the pattern may have stopped one out if the stop was advanced
quickly. If the initial stop was held tight, giving time for the play to
develop, the potential was much better.
I'm like a broken record when I talk about
the ABCD pattern. I see them all the time, and trade them regularly. I look for
them extensively in FOREX trading. The key, for me, is picking the right ones,
based on proper 'context'. I think it is an underutilized pattern.
The next
commentary will be the mid-week edition, posted Wednesday. I expect it will be
shorter than today's commentary.
|
|
|
| |
|
|
 NOTE: Reading this page or
any page on the Kane Trading website, or utilizing this website and any
material NOTE: Reading this page or
any page on the Kane Trading website, or utilizing this website and any
material
contained herein in any way, shall constitute an
acknowledgement that you have read, understood and agreed
to
all the disclaimers,
terms & conditions, and
policies of this site.
|
|
|
This
website is best viewed with MSIE 6.0, text size set to medium, and screen
resolution set to 1024 by 768.
Copyright
© 2004 Kane Trading. All rights reserved.
|
|