|
|
| |
|
 December
8, 2004 Commentary (mid-week edition)- December
8, 2004 Commentary (mid-week edition)-
 Today I'm
going to show something interesting that set up Tuesday. First, though, I'm
going to talk a little business, and then we'll get to it. I want to keep
reminding everyone that in about a week I'm taking my well-earned break. If you
want to order any books, especially if you want me to ship them before
Christmas, please do this by the weekend, or the very early part of next week.
It will be tough on me if you order just before I start my break. Today I'm
going to show something interesting that set up Tuesday. First, though, I'm
going to talk a little business, and then we'll get to it. I want to keep
reminding everyone that in about a week I'm taking my well-earned break. If you
want to order any books, especially if you want me to ship them before
Christmas, please do this by the weekend, or the very early part of next week.
It will be tough on me if you order just before I start my break.
 Although you
can order while I'm gone, understand that I will not be checking any e-mails,
shipping any books, or writing any commentaries until I 'return to work' right
after the first of the year. If you are uncomfortable with ordering while I'm
gone and waiting, please order now or wait until I return. Although you
can order while I'm gone, understand that I will not be checking any e-mails,
shipping any books, or writing any commentaries until I 'return to work' right
after the first of the year. If you are uncomfortable with ordering while I'm
gone and waiting, please order now or wait until I return.
 Now, let's
get to some charts. Something similar set up on just about all the indices, the
SOX, and many specific issues, all at about the same time, and in about the
same manner. There was so much going on that I could literally spend an entire
day with a mentorship student just covering all of what was happening. It ranks
in there with some of my best all-time examples for educational
purposes. Now, let's
get to some charts. Something similar set up on just about all the indices, the
SOX, and many specific issues, all at about the same time, and in about the
same manner. There was so much going on that I could literally spend an entire
day with a mentorship student just covering all of what was happening. It ranks
in there with some of my best all-time examples for educational
purposes.
 As usual, we will only be able to briefly touch on a few of the
aspects in here, due to the limited time and space. I hate to keep repeating
that in just about every commentary, but I also hate to be able to cover so
little of what I see. I am going to look at the SMH for this example because it
stood out as the most different and perhaps least classic of all my choices.
There was so much going on that I may continue on with this example in future
commentaries. I'll see what comes up in the meantime. As usual, we will only be able to briefly touch on a few of the
aspects in here, due to the limited time and space. I hate to keep repeating
that in just about every commentary, but I also hate to be able to cover so
little of what I see. I am going to look at the SMH for this example because it
stood out as the most different and perhaps least classic of all my choices.
There was so much going on that I may continue on with this example in future
commentaries. I'll see what comes up in the meantime.
 I'll start
with a 3-minute chart, showing a setup that came together. I'll start
with a 3-minute chart, showing a setup that came together.

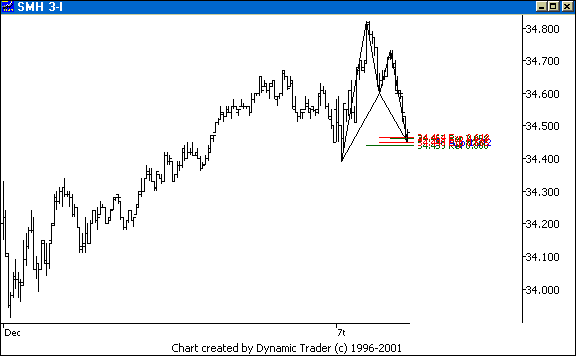
 The SMH put together a nice 5-point pattern,
set up to continue the uptrend. Notice the ABCD pattern right before this
5-point pattern. Right away that alerts me that something may be up. A solid
ABCD correction should correct things for a while. To get one sharp thrust up
and then another corrective ABCD pattern (highlighted this time as a 5-point
pattern. The previous ABCD pattern could also be seen as a 5-point pattern.),
well, that is unusual. The SMH put together a nice 5-point pattern,
set up to continue the uptrend. Notice the ABCD pattern right before this
5-point pattern. Right away that alerts me that something may be up. A solid
ABCD correction should correct things for a while. To get one sharp thrust up
and then another corrective ABCD pattern (highlighted this time as a 5-point
pattern. The previous ABCD pattern could also be seen as a 5-point pattern.),
well, that is unusual.
 Overall, I didn't like the layout. That doesn't mean I
would pass it up, but I'd want to do some more research and get a look at some
more things before I would be ready to trade it. But that's not the main focus
for today. Let's move on and see what happened off this pattern. Overall, I didn't like the layout. That doesn't mean I
would pass it up, but I'd want to do some more research and get a look at some
more things before I would be ready to trade it. But that's not the main focus
for today. Let's move on and see what happened off this pattern.

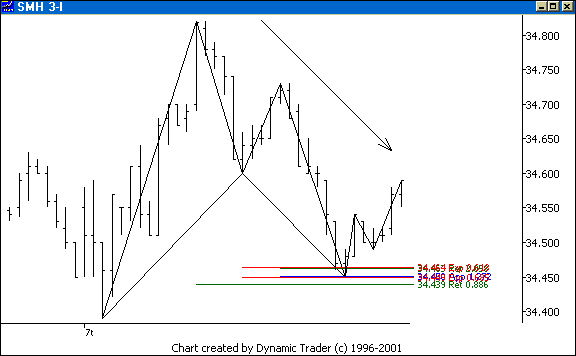
 Now this is what I mean when I say I want to
look at the price action. The SMH came right off the pattern, and then formed
this potential ABCD pattern. By the look of that bar close and the fact
that the CD leg is getting extended I'm not too worried about this yet, but it
should really get moving up right here, and not roll over. A rollover here has
me suspecting this is a small ABCD correction to a new downtrend, highlighted
by the big arrow. Now this is what I mean when I say I want to
look at the price action. The SMH came right off the pattern, and then formed
this potential ABCD pattern. By the look of that bar close and the fact
that the CD leg is getting extended I'm not too worried about this yet, but it
should really get moving up right here, and not roll over. A rollover here has
me suspecting this is a small ABCD correction to a new downtrend, highlighted
by the big arrow.
 The price action right here, at this spot, tells me a lot. Even if
I get 'headfaked' I don't care. If this rolls and I'm in on this larger 5-point
pattern, I'm either gone, just about ready to get out, and/or thinking about a
short. Maybe not shorting here ('flipping'), but watching the action and
looking for a short setup. The price action right here, at this spot, tells me a lot. Even if
I get 'headfaked' I don't care. If this rolls and I'm in on this larger 5-point
pattern, I'm either gone, just about ready to get out, and/or thinking about a
short. Maybe not shorting here ('flipping'), but watching the action and
looking for a short setup.
 Let's see what happened from here. Let's see what happened from here.

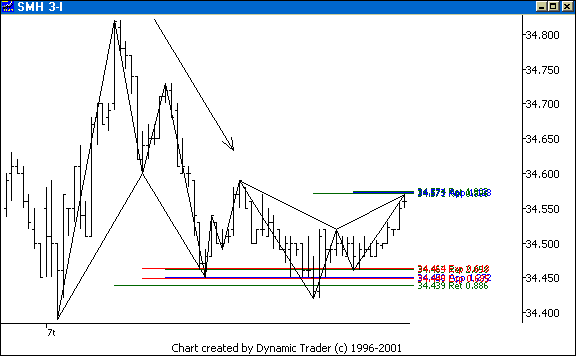
 The SMH rolled right over and violated the
pattern. If a trader was playing a pattern violation they got whipsawed right
out (unless they had a stop way wider than I would ever consider (based on a
technically placed stop from the chart, not in terms of cents, as explained in
Kane Trading on: Trade
Management). That's why I don't play pattern failures this way. I take
setups to anticipate them. One look at what formed next sure did not have me
thinking the bias was upward. I was seeing too many corrections (ABCD's)
telling me which way to look. The SMH rolled right over and violated the
pattern. If a trader was playing a pattern violation they got whipsawed right
out (unless they had a stop way wider than I would ever consider (based on a
technically placed stop from the chart, not in terms of cents, as explained in
Kane Trading on: Trade
Management). That's why I don't play pattern failures this way. I take
setups to anticipate them. One look at what formed next sure did not have me
thinking the bias was upward. I was seeing too many corrections (ABCD's)
telling me which way to look.
 This last 5-point pattern was just a gift,
plain and simple, for my trading methodology. Right at an .886, with a tight
grouping. Many pattern/swing-low failure traders were already shaken out. And
what you are seeing here was only a tiny fraction of what was going on. Play
with some median lines and other things, and look at the charts of the
indices. This last 5-point pattern was just a gift,
plain and simple, for my trading methodology. Right at an .886, with a tight
grouping. Many pattern/swing-low failure traders were already shaken out. And
what you are seeing here was only a tiny fraction of what was going on. Play
with some median lines and other things, and look at the charts of the
indices.
 Let's also take a brief look at some 'context' from a 13-minute
chart. Let's also take a brief look at some 'context' from a 13-minute
chart.

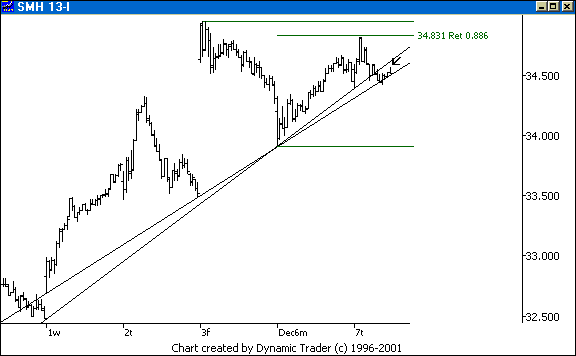
 I drew in two obvious trendlines. One has
been violated at this point, and the SMH is just creeping up the other. The
arrow shows where we left off on the 3-minute chart i.e. it's 'go time'. Notice
the SMH is just coming off a failed thrust up at an .886 retracement. This is
just teetering on a freefall here. I drew in two obvious trendlines. One has
been violated at this point, and the SMH is just creeping up the other. The
arrow shows where we left off on the 3-minute chart i.e. it's 'go time'. Notice
the SMH is just coming off a failed thrust up at an .886 retracement. This is
just teetering on a freefall here.
 I'll go back to the 3-minute chart and show
how the SMH reacted to the pattern. I'll go back to the 3-minute chart and show
how the SMH reacted to the pattern.

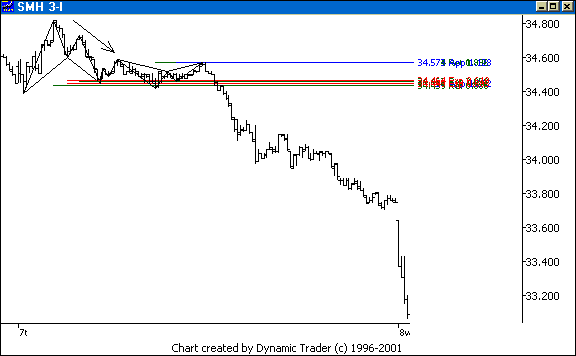
 The SMH did freefall off the pattern,
reversing to the penny off the .886 retracement, and going down to close that
big gap. This was an absolute crush. Set up similar scenarios with the indices
and various stocks and it should become quite clear how obvious the potential
trades were. Look at median lines and time factors. This was a truly amazing
situation. The SMH did freefall off the pattern,
reversing to the penny off the .886 retracement, and going down to close that
big gap. This was an absolute crush. Set up similar scenarios with the indices
and various stocks and it should become quite clear how obvious the potential
trades were. Look at median lines and time factors. This was a truly amazing
situation.
 Just because there is a pattern doesn't mean it's the
place I want to be trading. And sometimes the action and layout ('context') of
a pattern can alert me to a much better upcoming opportunity. I think far too
many traders just trade the pattern, end of story. Just because there is a pattern doesn't mean it's the
place I want to be trading. And sometimes the action and layout ('context') of
a pattern can alert me to a much better upcoming opportunity. I think far too
many traders just trade the pattern, end of story.
 That's why I
came up with my saying "A pattern, in and of itself, is not enough reason for
me to trade." and my book Kane
Trading on: Multiple Timeframes and 'Context'. Maybe next I'll start
'Pattern Traders Anonymous', for all those that just can't say no simply
because it's a pattern. 'Context', 'context', 'context', my friends. That's why I
came up with my saying "A pattern, in and of itself, is not enough reason for
me to trade." and my book Kane
Trading on: Multiple Timeframes and 'Context'. Maybe next I'll start
'Pattern Traders Anonymous', for all those that just can't say no simply
because it's a pattern. 'Context', 'context', 'context', my friends.
 The next
commentary will be the weekend edition, posted by Sunday evening (but probably
by Saturday this time). The next
commentary will be the weekend edition, posted by Sunday evening (but probably
by Saturday this time).
 |
|
|
| |
|
|
 NOTE: Reading this page or
any page on the Kane Trading website, or utilizing this website and any
material NOTE: Reading this page or
any page on the Kane Trading website, or utilizing this website and any
material
contained herein in any way, shall constitute an
acknowledgement that you have read, understood and agreed
to
all the disclaimers,
terms & conditions, and
policies of this site.
 |
|
 This
website is best viewed with MSIE 6.0, text size set to medium, and screen
resolution set to 1024 by 768.
 Copyright
© 2004 Kane Trading. All rights reserved. Copyright
© 2004 Kane Trading. All rights reserved.
 |
|


