|
|
| |
|
 November
20, 2005 Commentary (weekend edition)- November
20, 2005 Commentary (weekend edition)-
 Due to being
'under the weather' I wasn't able to get this posted until Monday night. Two
charts will reflect data from Monday's trading. Due to being
'under the weather' I wasn't able to get this posted until Monday night. Two
charts will reflect data from Monday's trading.
 Well, this market just continues to
trade great. I have a lot to say about that, but this just isn't the forum for
it. That's more suited to the members' area, where I can
present things on a regular basis, as they unfold, or at the very least in
small pieces. No one likes a big dissertation in one shot. It all comes down to
my going with the flow, and that is clearly up, until the flow stops going up.
I'm a bit wary, as the underlying 'fundamentals' just don't have me convinced
this isn't still a cyclical bull market in a secular bear market. Well, this market just continues to
trade great. I have a lot to say about that, but this just isn't the forum for
it. That's more suited to the members' area, where I can
present things on a regular basis, as they unfold, or at the very least in
small pieces. No one likes a big dissertation in one shot. It all comes down to
my going with the flow, and that is clearly up, until the flow stops going up.
I'm a bit wary, as the underlying 'fundamentals' just don't have me convinced
this isn't still a cyclical bull market in a secular bear market.
 Look at '70
and then '73-'74 to see what I mean. I did a nice workup on this in the
members' section, and I don't want to redo it here, but let me say it is not
uncommon for many new all-time highs to be set before the next new low. New
all-time highs in a bear market. Odd, but not uncommon. I'm not saying I think
this is for certain a secular bear market, I just think the larger
approximately 18-year cycle shouldn't be discounted completely, without a
second thought. When everyone is on one side of the boat… Look at '70
and then '73-'74 to see what I mean. I did a nice workup on this in the
members' section, and I don't want to redo it here, but let me say it is not
uncommon for many new all-time highs to be set before the next new low. New
all-time highs in a bear market. Odd, but not uncommon. I'm not saying I think
this is for certain a secular bear market, I just think the larger
approximately 18-year cycle shouldn't be discounted completely, without a
second thought. When everyone is on one side of the boat…
 Let me say,
too, that although I constantly point to the members' section, and mention what
I cover in there, and won't be covering in here, that is simply to point out
that if the things I am mentioning are of interest to you, the members' area is
where I am doing detailed work on that. I'm not trying to 'push' the area. As
it is right now, I am giving serious consideration to closing down the service.
I enjoy it greatly, but to do the quality of work I must do (I do everything
top quality, or I don't do it at all), the quality of work the service has
evolved to, it takes a lot of time. Let me say,
too, that although I constantly point to the members' section, and mention what
I cover in there, and won't be covering in here, that is simply to point out
that if the things I am mentioning are of interest to you, the members' area is
where I am doing detailed work on that. I'm not trying to 'push' the area. As
it is right now, I am giving serious consideration to closing down the service.
I enjoy it greatly, but to do the quality of work I must do (I do everything
top quality, or I don't do it at all), the quality of work the service has
evolved to, it takes a lot of time.
 Now, there is nothing wrong with
doing high quality work, spending a fair amount of time on it, and making great
money doing it. It's just that, as I have said, my interest is as a trader. I
wrote the books, and I do the occasional mentorship, but I am running out of
energy to work from sunrise until long after sunset, seven days a week. I want
to concentrate on my own trading, and then go have some other kind of fun, to
recharge my batteries. I haven't made the decision yet, but it is likely I am
going to end the service, perhaps sometime early next year. I will retain the
entire archive as a resource, and probably give access to that for a period of
time for full set buyers. Now, there is nothing wrong with
doing high quality work, spending a fair amount of time on it, and making great
money doing it. It's just that, as I have said, my interest is as a trader. I
wrote the books, and I do the occasional mentorship, but I am running out of
energy to work from sunrise until long after sunset, seven days a week. I want
to concentrate on my own trading, and then go have some other kind of fun, to
recharge my batteries. I haven't made the decision yet, but it is likely I am
going to end the service, perhaps sometime early next year. I will retain the
entire archive as a resource, and probably give access to that for a period of
time for full set buyers.
 If I get a huge outcry begging me not to stop the
service I may rethink it, but I just don't want to spend that much time
indefinitely. Many people have advised me to simply cut it back, as the value
for the service is many, many-fold more than the cost. I could do this, but I
am so quality oriented that I just struggle to offer it up at any less volume
and detail than I do now. We'll leave this 'on the table' for now, but I wanted
to throw it out there that it is a change I may be making. This market is just
too good for me to have anything else to do but concentrate directly on
it. If I get a huge outcry begging me not to stop the
service I may rethink it, but I just don't want to spend that much time
indefinitely. Many people have advised me to simply cut it back, as the value
for the service is many, many-fold more than the cost. I could do this, but I
am so quality oriented that I just struggle to offer it up at any less volume
and detail than I do now. We'll leave this 'on the table' for now, but I wanted
to throw it out there that it is a change I may be making. This market is just
too good for me to have anything else to do but concentrate directly on
it.
 For today I'm going to borrow from the members' area and follow up
on the gold play, and then show something in BZH, which I mentioned in here
when we looked at DHI. Not much has happened yet with crude, so I won't discuss
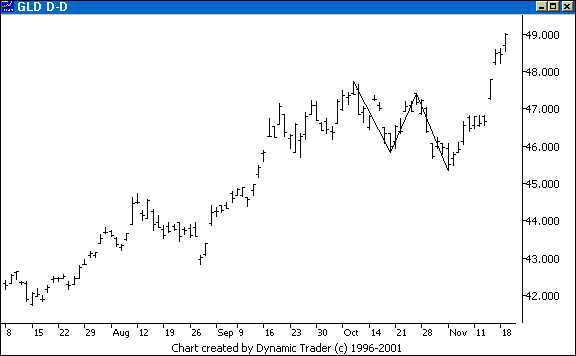
Jim's Chart of the Week from last weekend. Let's start with gold. I'll show
this in GLD, for those that prefer stocks (in this case an ETF) to futures, or
just don't trade futures. For today I'm going to borrow from the members' area and follow up
on the gold play, and then show something in BZH, which I mentioned in here
when we looked at DHI. Not much has happened yet with crude, so I won't discuss
Jim's Chart of the Week from last weekend. Let's start with gold. I'll show
this in GLD, for those that prefer stocks (in this case an ETF) to futures, or
just don't trade futures.


 "Gold is still moving. $500 is readily
accepted as a foregone conclusion, and many have targets up higher. All I care
about is riding and milking my own play. I have no idea where it's going, or
where it may stop. Maybe it's done right here. It's on fire now, but it isn't
due to inflation, it's due to Chinese and Indian demand for jewelry. Phew, I
was worried there, but they set me straight. They didn't mention that the only
way for people to hold gold in those countries is in the form of jewelry,
though. Oh, and don't worry about platinum ready to take out $1,000, as they
said that is simply because of auto demand for catalytic converters. Hmm, must
be foreign automakers, with GM laying off 30,000 workers, or did they say
35,000? I forgot." "Gold is still moving. $500 is readily
accepted as a foregone conclusion, and many have targets up higher. All I care
about is riding and milking my own play. I have no idea where it's going, or
where it may stop. Maybe it's done right here. It's on fire now, but it isn't
due to inflation, it's due to Chinese and Indian demand for jewelry. Phew, I
was worried there, but they set me straight. They didn't mention that the only
way for people to hold gold in those countries is in the form of jewelry,
though. Oh, and don't worry about platinum ready to take out $1,000, as they
said that is simply because of auto demand for catalytic converters. Hmm, must
be foreign automakers, with GM laying off 30,000 workers, or did they say
35,000? I forgot."
 Let's look at what I was showing on BZH. This was
discussed in advance, of course, but we'll come in a bit later right
now. Let's look at what I was showing on BZH. This was
discussed in advance, of course, but we'll come in a bit later right
now.


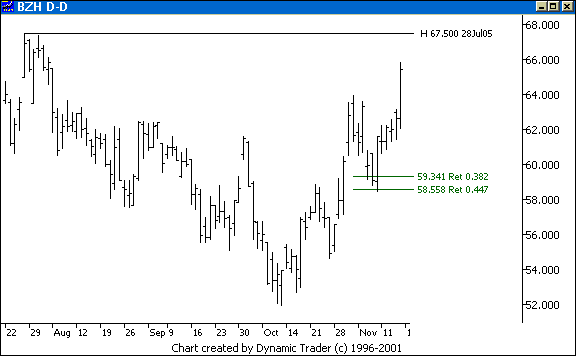
 "Well, the housing market may be totally
dead, utterly and completely collapsed as they said over and over today (my
favorite for the day was: real estate is so 'last year'), but you can't
tell from the stocks. BZH dropped a bit lower to the .447 retracement before
launching straight up. Notice the previous swing-high point with respect to the
.447. As I showed before, that's the all-time high right there overhead,
a little over a dollar away. Looks dead to me. "Well, the housing market may be totally
dead, utterly and completely collapsed as they said over and over today (my
favorite for the day was: real estate is so 'last year'), but you can't
tell from the stocks. BZH dropped a bit lower to the .447 retracement before
launching straight up. Notice the previous swing-high point with respect to the
.447. As I showed before, that's the all-time high right there overhead,
a little over a dollar away. Looks dead to me.
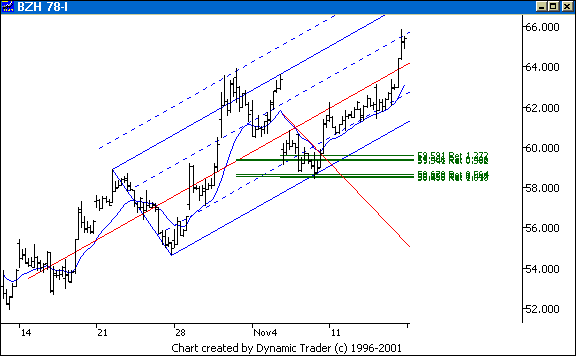
 Let's look at this on a lower
timeframe. I'll go with a 78-minute chart to have 5 bars per day, hence having
5 times the data down here as on the daily chart. Let's look at this on a lower
timeframe. I'll go with a 78-minute chart to have 5 bars per day, hence having
5 times the data down here as on the daily chart.


 Here's the basic setup, with two groupings
based on the .382 and .447 retracements. This is very close to a (deleted for
free commentary, sorry) ABCD pullback. Notice the reaction off the .382 area,
and then the rollover to the lower grouping and ML lower //. I put a 15-period
exponential moving average on the chart, and laid a trendline along that
line. Here's the basic setup, with two groupings
based on the .382 and .447 retracements. This is very close to a (deleted for
free commentary, sorry) ABCD pullback. Notice the reaction off the .382 area,
and then the rollover to the lower grouping and ML lower //. I put a 15-period
exponential moving average on the chart, and laid a trendline along that
line.
 Now we get to why I wanted to show this. Study the swing-highs and
notice until the action actually reversed no swing-highs were taken out, and
the trendline wasn't violated. It was clear when the action had reversed. I
don't like to get in on the smallest little bounces off each area I watch. I
wait until I see clear signs the action has changed direction. This is right
out of Entry Techniques. I
'pay up' for this, but for me I must do it this way. I don't want to be
triggered in on every little wiggle. I want in when the action is in the
direction I want to trade. That's how I know which grouping to trade off
of. I trade it after the fact. We all joke how easy it would be to trade
after the fact. I simply wait until the area has told me, with past data, it
has reversed. I then look, usually on an even lower timeframe, for a small
pullback to get in on. Now we get to why I wanted to show this. Study the swing-highs and
notice until the action actually reversed no swing-highs were taken out, and
the trendline wasn't violated. It was clear when the action had reversed. I
don't like to get in on the smallest little bounces off each area I watch. I
wait until I see clear signs the action has changed direction. This is right
out of Entry Techniques. I
'pay up' for this, but for me I must do it this way. I don't want to be
triggered in on every little wiggle. I want in when the action is in the
direction I want to trade. That's how I know which grouping to trade off
of. I trade it after the fact. We all joke how easy it would be to trade
after the fact. I simply wait until the area has told me, with past data, it
has reversed. I then look, usually on an even lower timeframe, for a small
pullback to get in on.
 Sometimes I just have to go or I'll miss it. Keep in
mind this is based on a trend started off a weekly pattern, making a run at new
all-time highs. To quibble about paying up a bit on a 15-minute chart is
self-defeating for me. One look at the price action and layout here and it
jumps right out at me where I want in. Traders have to decide on their own
'Trading Plan', but this is my approach, and it works far better for me than
anything else I have found so far. Look back on all the ones we have been
looking at as they reversed at their 'trend retracement' areas and apply this
approach and see how clear it was. That's what I do most of the time with all
these 'action spots' I show in here when I decide I want to trade
them." Sometimes I just have to go or I'll miss it. Keep in
mind this is based on a trend started off a weekly pattern, making a run at new
all-time highs. To quibble about paying up a bit on a 15-minute chart is
self-defeating for me. One look at the price action and layout here and it
jumps right out at me where I want in. Traders have to decide on their own
'Trading Plan', but this is my approach, and it works far better for me than
anything else I have found so far. Look back on all the ones we have been
looking at as they reversed at their 'trend retracement' areas and apply this
approach and see how clear it was. That's what I do most of the time with all
these 'action spots' I show in here when I decide I want to trade
them."
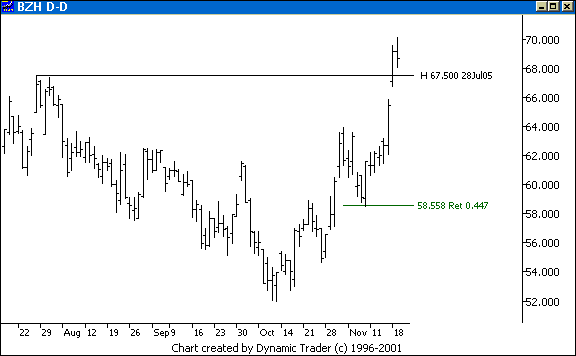
 And let's finish with where BZH is today. And let's finish with where BZH is today.


 BZH kept moving off that area. (I discussed
the pattern and setup in more detail in the members' area. It was a lot more
than a single retracement, of course, some of which can be seen on that
78-minute chart.) It blasted off to all-time new highs on a big gap move. This
one laid out beautifully for me, triggered nicely, and gave me a great,
'outsized' move. All this, when all the talking heads on television could say
was how dead the homebuilding stocks were. The sentiment hit so well with the
setups that it was practically a 'no-brainer' for me to lay this one
out. BZH kept moving off that area. (I discussed
the pattern and setup in more detail in the members' area. It was a lot more
than a single retracement, of course, some of which can be seen on that
78-minute chart.) It blasted off to all-time new highs on a big gap move. This
one laid out beautifully for me, triggered nicely, and gave me a great,
'outsized' move. All this, when all the talking heads on television could say
was how dead the homebuilding stocks were. The sentiment hit so well with the
setups that it was practically a 'no-brainer' for me to lay this one
out.
 The next commentary will be next weekend's edition, posted by
Sunday evening, November 27, 2005 (assuming I'm back to 'normal'). The next commentary will be next weekend's edition, posted by
Sunday evening, November 27, 2005 (assuming I'm back to 'normal').
 |
|
|
| |
|
|
 NOTE: Reading this page or
any page on the Kane Trading website, or utilizing this website and any
material NOTE: Reading this page or
any page on the Kane Trading website, or utilizing this website and any
material
contained herein in any way, shall constitute an
acknowledgment that you have read, understood and agreed
to all
the disclaimers,
terms & conditions, and
policies of this site.
 |
|
 This
website is best viewed with MSIE 6.0, text size set to medium, and screen
resolution set to 1024 by 768.
 Copyright
© 2005 Kane Trading. All rights reserved. Copyright
© 2005 Kane Trading. All rights reserved.
 |
|


