|
|
| |
|
 March 5,
2006 Commentary (weekend edition)- March 5,
2006 Commentary (weekend edition)-
 I had a great
weekend doing my latest mentorship. Actually, this is a very serious student,
in transition from a very high-paying business to his goal of being a
full-time, independent trader. He is in his third mentorship with me, and it
has turned into more of an internship than a mentorship, if you will. The level
of work we are doing is just remarkable to me. As I mentioned last week, our
entire focus was just on my latest work on 'price flow' and the reading of
price action. I found it curious just how much I know in that area without
realizing it, or really having it 'verbalized', so to speak. I had a great
weekend doing my latest mentorship. Actually, this is a very serious student,
in transition from a very high-paying business to his goal of being a
full-time, independent trader. He is in his third mentorship with me, and it
has turned into more of an internship than a mentorship, if you will. The level
of work we are doing is just remarkable to me. As I mentioned last week, our
entire focus was just on my latest work on 'price flow' and the reading of
price action. I found it curious just how much I know in that area without
realizing it, or really having it 'verbalized', so to speak.
 My style and
structure for the mentorships is not 'canned' or pre-planned. I tailor it to
the individual student, and I basically just go through what it is I do, and
show how I apply my methodology, step by step. When I reach the level I have
with this particular student I'm in new territory. I've never even had the
opportunity to discuss these concepts, at this level, with anyone before.
Although I was able to explain them quite clearly I feel, it is a very
interesting experience to show things one has never verbalized before. My point
is, I left feeling almost overwhelmed with the depth and magnitude of what it
is I actually do, and what I've discovered. My style and
structure for the mentorships is not 'canned' or pre-planned. I tailor it to
the individual student, and I basically just go through what it is I do, and
show how I apply my methodology, step by step. When I reach the level I have
with this particular student I'm in new territory. I've never even had the
opportunity to discuss these concepts, at this level, with anyone before.
Although I was able to explain them quite clearly I feel, it is a very
interesting experience to show things one has never verbalized before. My point
is, I left feeling almost overwhelmed with the depth and magnitude of what it
is I actually do, and what I've discovered.
 Now, given
this is Monday, I will still do my usual follow up on last week's chart of the
week, but I will then finish with some work in the mini Russell from something
that started on Friday and continued today. Let's start with last week's Jim's
Chart of the Week, in BNI. Now, given
this is Monday, I will still do my usual follow up on last week's chart of the
week, but I will then finish with some work in the mini Russell from something
that started on Friday and continued today. Let's start with last week's Jim's
Chart of the Week, in BNI.

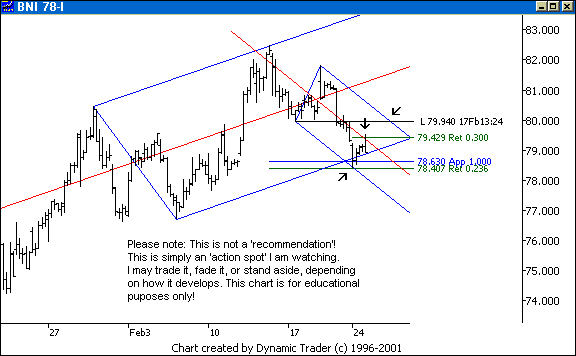
 BNI had formed this nice-looking ABCD, right
at a key line area. I wanted to watch the price action off the area, to aid me
in my management decisions. The first arrow shows the potential trade area
(PTA). The second arrow shows BNI's initial reaction to the median line for the
set I had on the ABCD itself. BNI had formed this nice-looking ABCD, right
at a key line area. I wanted to watch the price action off the area, to aid me
in my management decisions. The first arrow shows the potential trade area
(PTA). The second arrow shows BNI's initial reaction to the median line for the
set I had on the ABCD itself.
 I wanted to first see what happened there,
and if that was overcome, I wanted to watch the upper parallel, especially if
it drifted up slowly and happened to hit near that horizontal line from the key
swing-low, at the area of the third arrow. If the upper parallel was overcome,
the median line from the bigger set was the next area of interest. I had a lot
more to watch than this framework, of course, and there were a few other lines
I was especially watching. I wanted to first see what happened there,
and if that was overcome, I wanted to watch the upper parallel, especially if
it drifted up slowly and happened to hit near that horizontal line from the key
swing-low, at the area of the third arrow. If the upper parallel was overcome,
the median line from the bigger set was the next area of interest. I had a lot
more to watch than this framework, of course, and there were a few other lines
I was especially watching.
 I'll add a few things, and we'll see what BNI did from
here. I'll add a few things, and we'll see what BNI did from
here.

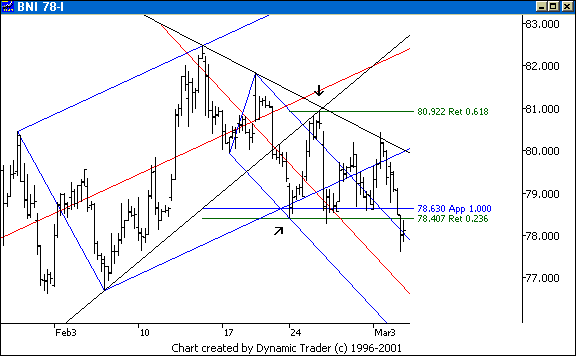
 I added on one of my 'crazy' trendlines
(there is a method to the madness, it's not after-the-fact line fitting), a key
overhead trendline, and a .618 retracement. BNI continued off the PTA, through
the ABCD set's upper parallel, and past my 'first thrust' line (not shown).
Those that have Kane Trading on:
Trade Management understand the significance of this first thrust line.
The median line for the larger set is approached. I now have more than enough
to 'go to work'. BNI did all I can ask for up to this point. I added on one of my 'crazy' trendlines
(there is a method to the madness, it's not after-the-fact line fitting), a key
overhead trendline, and a .618 retracement. BNI continued off the PTA, through
the ABCD set's upper parallel, and past my 'first thrust' line (not shown).
Those that have Kane Trading on:
Trade Management understand the significance of this first thrust line.
The median line for the larger set is approached. I now have more than enough
to 'go to work'. BNI did all I can ask for up to this point.
 BNI then
rolled over right off that 'crazy' trendline, key overhead trendline, .618
retracement, and median line area. This is just a framework, and I did have
other things coming together there. The point here is not how highly I rated
this area, it's that it was an obvious area I wanted to watch, and BNI reacted
to it. I factor this in my unfolding management plan. From here, I have several
areas I watch to read the action on the way down. I explain this in detail in
Kane Trading on: Trade
Management. BNI continues down, and my plan has me scaling out 'on the
way down' in situations like this. Overall, not a big play, but a reasonable
single. BNI then
rolled over right off that 'crazy' trendline, key overhead trendline, .618
retracement, and median line area. This is just a framework, and I did have
other things coming together there. The point here is not how highly I rated
this area, it's that it was an obvious area I wanted to watch, and BNI reacted
to it. I factor this in my unfolding management plan. From here, I have several
areas I watch to read the action on the way down. I explain this in detail in
Kane Trading on: Trade
Management. BNI continues down, and my plan has me scaling out 'on the
way down' in situations like this. Overall, not a big play, but a reasonable
single.
 If the play (the structure of the 'trade premise') was for a much
larger move on the higher timeframe, it would be around a scratch based on the
methods in TM. Regardless of all that, it gave me all I needed to get
started, it gave me lots of clues as it moved, and it talked to me all the way
back down. This is all I can ask for, and then I just keep working until I
catch one. I refer back to my poker analogy: check, fold, fold, check, check,
BAMM, got a big pot. If the play (the structure of the 'trade premise') was for a much
larger move on the higher timeframe, it would be around a scratch based on the
methods in TM. Regardless of all that, it gave me all I needed to get
started, it gave me lots of clues as it moved, and it talked to me all the way
back down. This is all I can ask for, and then I just keep working until I
catch one. I refer back to my poker analogy: check, fold, fold, check, check,
BAMM, got a big pot.
 Let's take a look at something in my favorite trading
vehicle, the mini Russell, on the 3-minute timeframe. Let's take a look at something in my favorite trading
vehicle, the mini Russell, on the 3-minute timeframe.

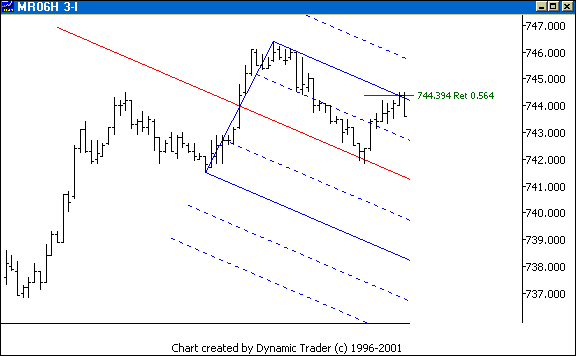
 On Friday I was working with this set, and it
guided me to a potential sell spot. The details of what I am doing here are in
Kane Trading on: Median Line and
Fibonacci Synergy. As always, I am only showing the salient points here
in this framework. At this point I am just setting the stage for what I saw
today. When a set is useful to me, and 'proves' itself, I weigh it in more
heavily with future decision making. On Friday I was working with this set, and it
guided me to a potential sell spot. The details of what I am doing here are in
Kane Trading on: Median Line and
Fibonacci Synergy. As always, I am only showing the salient points here
in this framework. At this point I am just setting the stage for what I saw
today. When a set is useful to me, and 'proves' itself, I weigh it in more
heavily with future decision making.
 Let's see what happened from here, to further
set our stage. Let's see what happened from here, to further
set our stage.

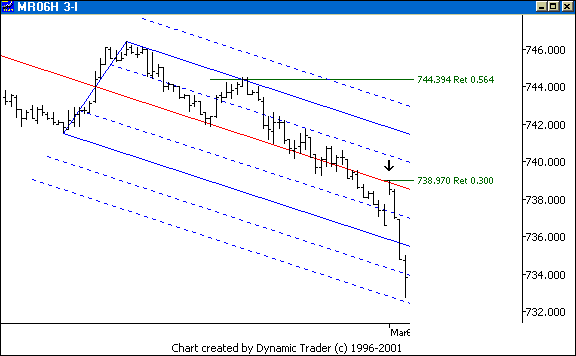
 The MR continued to sell, as we all remember.
When it gapped up today it did so right to a .300 retracement area, right at
that median line. This was the first opportunity for today for me. The MR
dropped like a rock, right to the first warning line. The MR continued to sell, as we all remember.
When it gapped up today it did so right to a .300 retracement area, right at
that median line. This was the first opportunity for today for me. The MR
dropped like a rock, right to the first warning line.
 Let's see
what shaped up from there. Let's see
what shaped up from there.

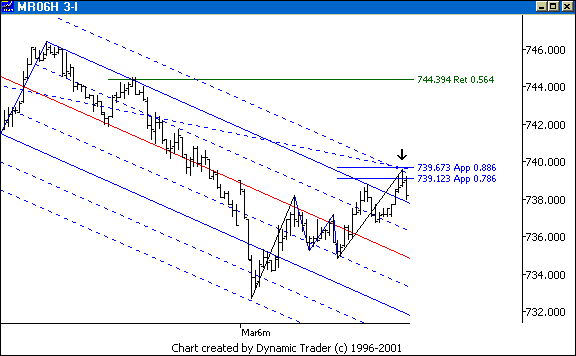
 The MR then formed a very nice-looking ABCD
pattern, with an ABCD in the BC leg. It would have been easy to be looking
right at that upper parallel, but the factors just didn't line up near as well
for me there. Note how the .786 alternate ABCD was above that point. The MR then formed a very nice-looking ABCD
pattern, with an ABCD in the BC leg. It would have been easy to be looking
right at that upper parallel, but the factors just didn't line up near as well
for me there. Note how the .786 alternate ABCD was above that point.
 I added
another line on there, the dotted line that hits right into the reversal area.
I will leave it as an exercise for the reader to determine where I got that
line from, but I will say it is from a very significant set, based on work
right out of MLFS. Keeping in mind that this is only a framework for
this PTA, it is clear why I was heavily in favor of this area at the first
upper division line. Readers of Kane
Trading on: Trading ABCD Patterns clearly know what I was waiting
for. I added
another line on there, the dotted line that hits right into the reversal area.
I will leave it as an exercise for the reader to determine where I got that
line from, but I will say it is from a very significant set, based on work
right out of MLFS. Keeping in mind that this is only a framework for
this PTA, it is clear why I was heavily in favor of this area at the first
upper division line. Readers of Kane
Trading on: Trading ABCD Patterns clearly know what I was waiting
for.
 Let's see what happened from here. Let's see what happened from here.

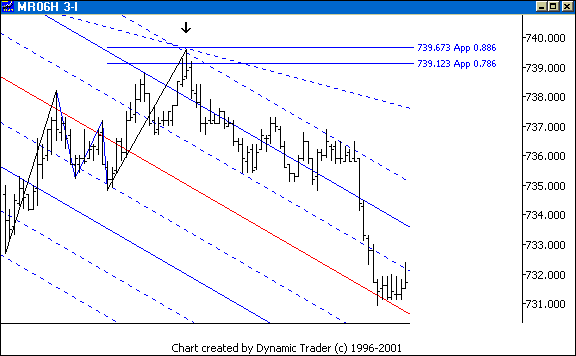
 The MR triggered nicely right off the area,
sold off a bit, and then formed an ABCD out of Kane Trading on: Four 'New' ABCD Pattern
Variations, and then the real selling came in, right down to the median
line. After this the MR sold a bit more before bouncing up a bit. All in all
this set gave me a lot of useful information to build my trading premises
around. Notice how well the lines for this set were 'seen' by the MR, over and
over as price moved up and down and all over the place. I can't emphasize how
much I benefit from working within frameworks as I set up my various scenarios.
Understand, too, that all this is occurring within larger frameworks and
'context', and that is guiding me, too. The MR triggered nicely right off the area,
sold off a bit, and then formed an ABCD out of Kane Trading on: Four 'New' ABCD Pattern
Variations, and then the real selling came in, right down to the median
line. After this the MR sold a bit more before bouncing up a bit. All in all
this set gave me a lot of useful information to build my trading premises
around. Notice how well the lines for this set were 'seen' by the MR, over and
over as price moved up and down and all over the place. I can't emphasize how
much I benefit from working within frameworks as I set up my various scenarios.
Understand, too, that all this is occurring within larger frameworks and
'context', and that is guiding me, too.
 As I close, keep an eye on those treasuries,
especially that free-falling 10-year. The 10-year is still moving off the ABCD
pattern I showed in here awhile back, but now it is getting to the 'critical
for the economy and the housing market' stage. Take a look at gold, which is
making key decisions off the ABCD pattern I discussed in here shortly ago. I
selected that for Jim's Chart of the Week, which is now posted. Watch those
currencies, and energy. This is a very important time for my intermarket
analysis, as things of great significance are setting up. I think it would be a
very prudent time to do some extra chart work on these crucial components of
the market. As I close, keep an eye on those treasuries,
especially that free-falling 10-year. The 10-year is still moving off the ABCD
pattern I showed in here awhile back, but now it is getting to the 'critical
for the economy and the housing market' stage. Take a look at gold, which is
making key decisions off the ABCD pattern I discussed in here shortly ago. I
selected that for Jim's Chart of the Week, which is now posted. Watch those
currencies, and energy. This is a very important time for my intermarket
analysis, as things of great significance are setting up. I think it would be a
very prudent time to do some extra chart work on these crucial components of
the market.
 The next commentary will be next weekend's edition, posted by
Sunday evening, March 12, 2006. The next commentary will be next weekend's edition, posted by
Sunday evening, March 12, 2006.
 |
|
|
| |
|
|
 NOTE: Reading this page or
any page on the Kane Trading website, or utilizing this website and any
material NOTE: Reading this page or
any page on the Kane Trading website, or utilizing this website and any
material
contained herein in any way, shall constitute an
acknowledgment that you have read, understood and agreed
to all
the disclaimers,
terms & conditions, and
policies of this site.
 |
|
 This
website is best viewed with MSIE 6.0, text size set to medium, and screen
resolution set to 1024 by 768.
 Copyright
© 2006 Kane Trading. All rights reserved. Copyright
© 2006 Kane Trading. All rights reserved.
 |
|


